Scheduling: Schedule Risk Analysis (SRA)
A Schedule Risk Analysis (SRA) simulation, also known as Monte Carlo, is a mathematical technique used to estimate the possible outcomes of an uncertain event. Instead of relying on a single "best-guess" number, it uses probability distributions to account for risk and uncertainty.
The process involves running a model thousands of times, each time using a different set of random values within a defined range. This creates a range of possible results and the likelihood of each one occurring.
How to Use This Function or Component (End User)
Note: Only users that are in a profile (Project Access) that enables them full access to the schedule (ie: Gantt) will be able to utilize the schedule Risk Analysis feature.
Running the Analysis
The Schedule Risk Analysis page is broken up into 4 sections:
Area | Location | Purpose |
|---|---|---|
Configuration panels (1) | Left column | Set up task distributions, risk events, and correlations |
Simulation Settings (2) | Right sidebar | Choose iterations, target date, and float threshold |
Saved Settings (3) | Right sidebar (below Simulation Settings) | Save, load, share, rename, and delete named configurations |
Simulation Results (4) | Below configuration | Charts, tables, and analysis (appears after running a simulation) |
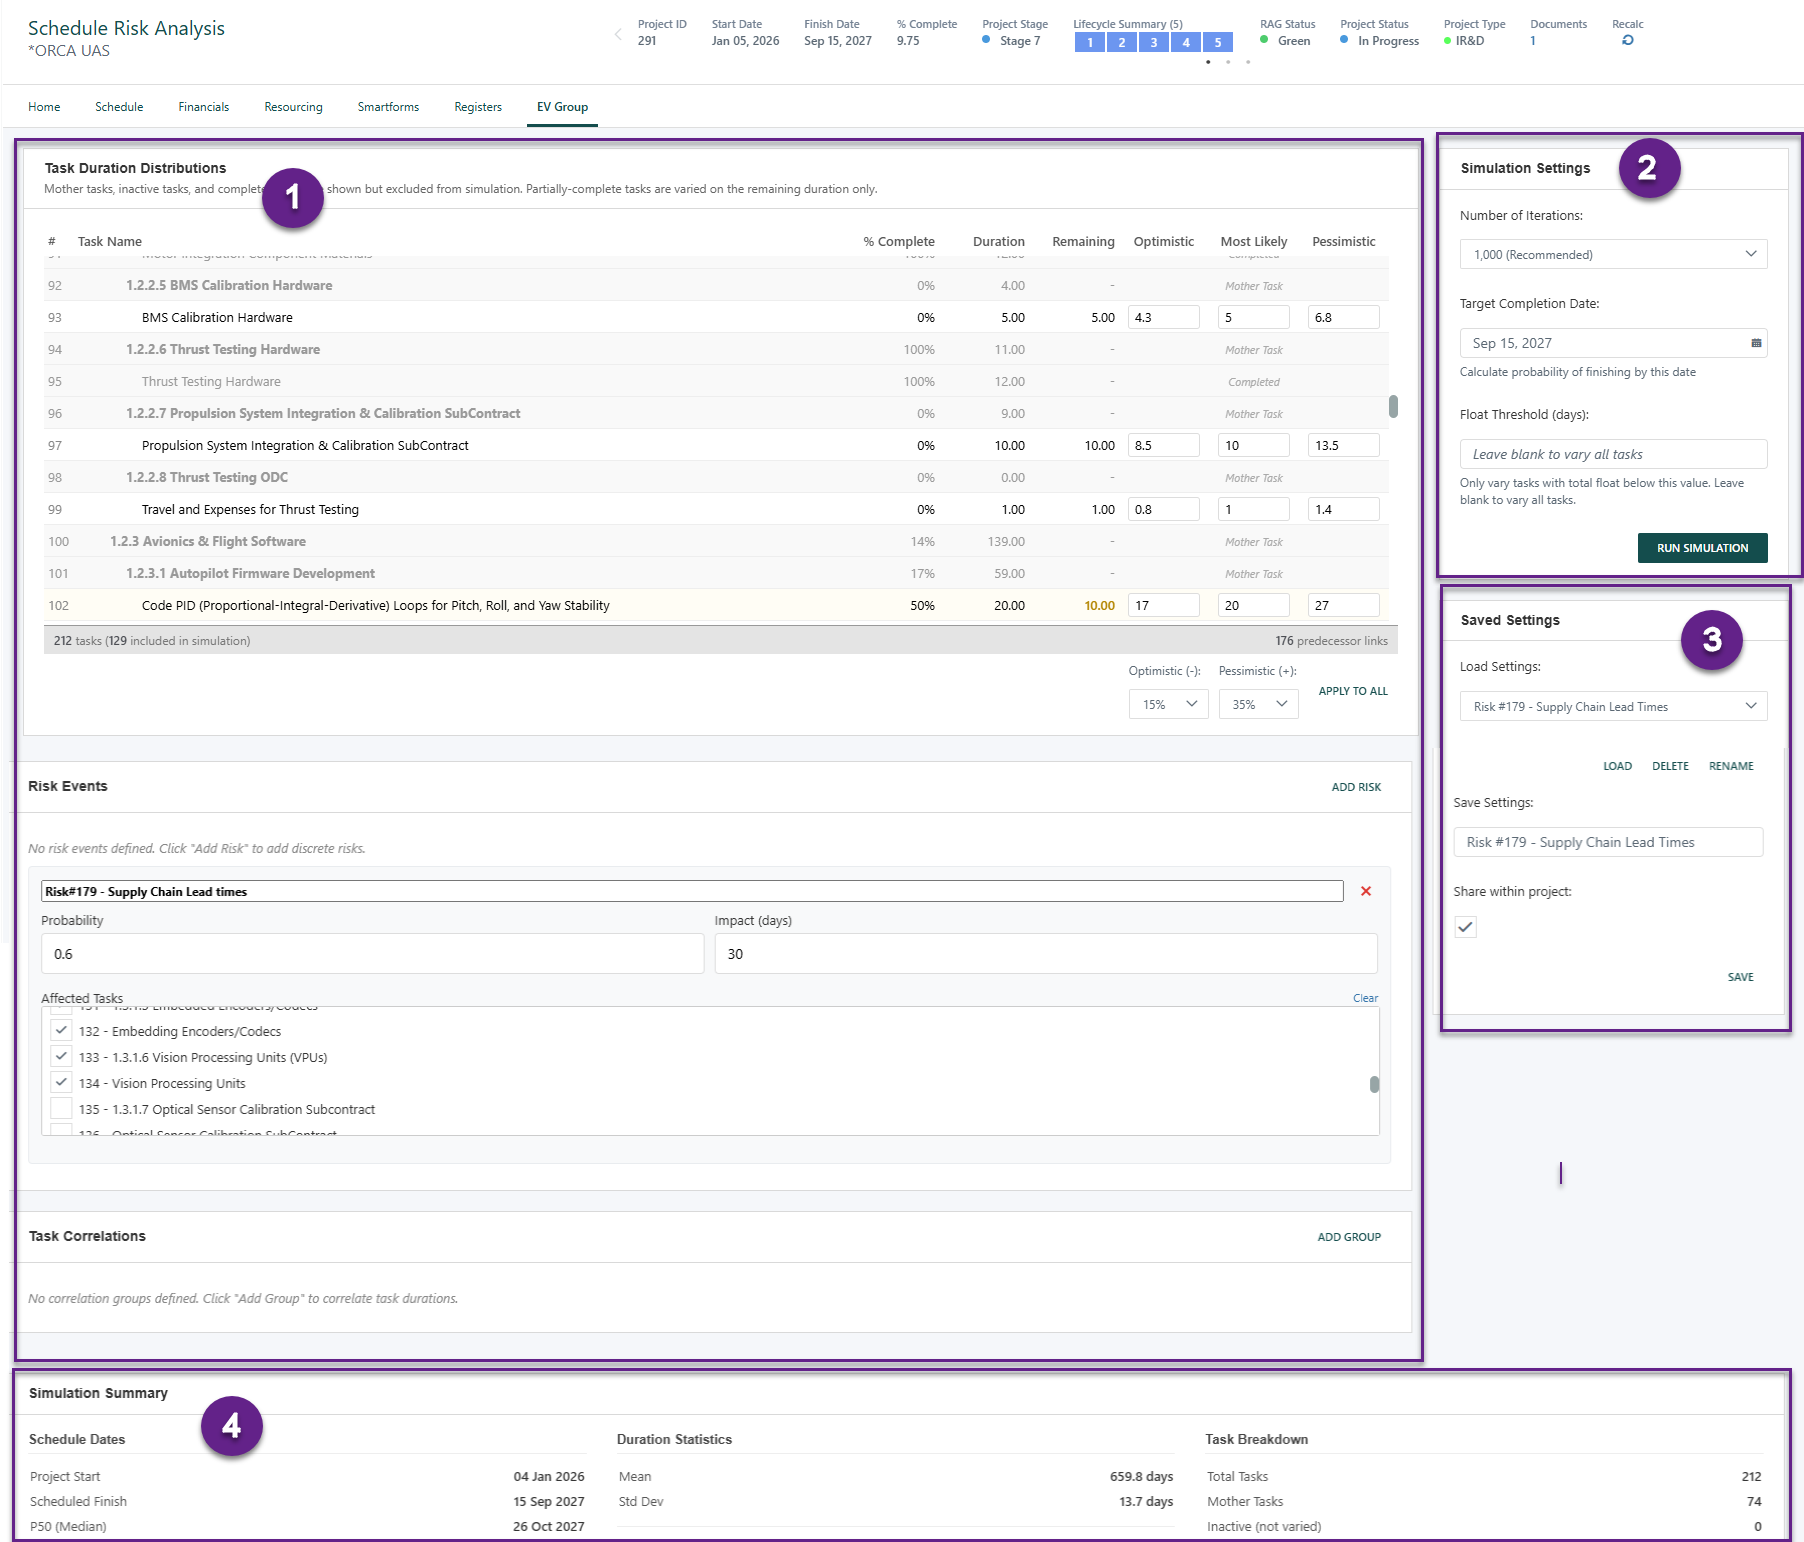
Step 1 — Configure Task Duration Distributions
The Task Duration Distributions panel shows every task in your schedule. For each task you specify three duration estimates that define a probability distribution. The engine supports two distribution shapes:
- Triangular — the default; defined by three points (optimistic, most likely, pessimistic).
- BetaPERT — a smoother bell-shaped curve that places more weight around the most likely value (uses a Beta distribution with shape parameter λ = 4). BetaPERT is the industry-standard distribution recommended by PMI and AACE for schedule risk analysis.
The three-point estimates used for either distribution are:
Column | Description |
|---|---|
# | Row number |
Task Name | Name of the task (indented to show hierarchy) |
% Complete | Current percentage complete |
Duration | Planned duration in days |
Remaining | Remaining duration (Duration × (1 − % Complete)) |
Optimistic | Shortest realistic duration (best-case) |
Most Likely | Most probable duration (usually equals the planned duration) |
Pessimistic | Longest realistic duration (worst-case) |
Which tasks are excluded?
The following tasks appear in the table but are not varied during simulation:
- Summary (mother) tasks — their dates are driven by child tasks
- Inactive tasks — flagged as inactive in the schedule
- Completed tasks (100% complete) — their duration is already known
- Milestones (zero duration) — unless you manually enter a distribution
Excluded tasks are shown greyed out so you can see the full schedule context.
Partially-complete tasks
If a task is partially complete (e.g. 40%), only the remaining portion of its duration is varied. The completed portion is locked. For example, a 10-day task at 40% complete has 6 remaining days — the simulation varies those 6 days, not the full 10.
Default Controls
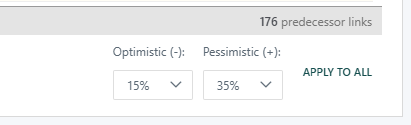
Below the table you will find controls to quickly set distributions for all tasks at once:
Control | Description |
|---|---|
Optimistic (−) dropdown | Percentage to subtract from each task's remaining duration to calculate the optimistic estimate. Default: 15% |
Pessimistic (+) dropdown | Percentage to add to each task's remaining duration to calculate the pessimistic estimate. Default: 35% |
Apply to All button | Applies the selected percentages to every eligible task in the table |
Example: With the defaults of −15% / +35% and a task with 10 remaining days:
- Optimistic = 10 × 0.85 = 8.5 days
- Most Likely = 10 days
- Pessimistic = 10 × 1.35 = 13.5 days
You can also edit any individual task's Optimistic, Most Likely, and Pessimistic values directly in the table.
Step 2 — Configure Risk Events (Optional)
Risk events represent discrete risks that may or may not occur, adding extra delay if they do. Click Add Risk to create a risk event.
Each risk event has the following fields:
Field | Description |
|---|---|
Risk Event Name | A descriptive name for the risk |
Probability | Likelihood the risk will occur (0 to 1). For example, 0.2 = 20% chance |
Impact (days) | Number of delay days added to affected tasks if the risk occurs |
Affected Tasks | Checklist of tasks impacted by this risk event |
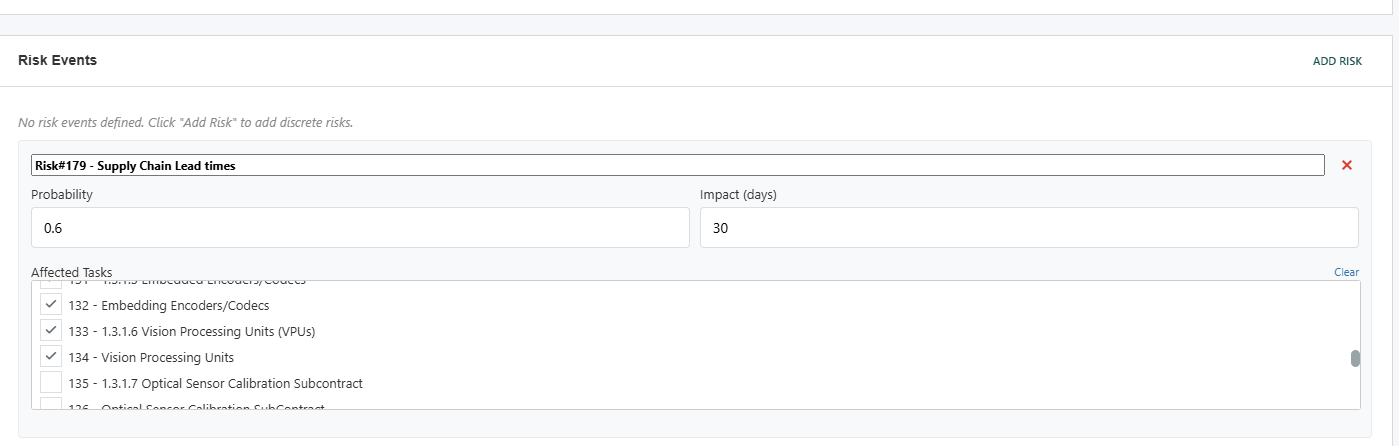
In each simulation iteration, the engine rolls the dice for every risk event. If a risk fires, its delay is added to the affected tasks for that iteration.
To remove a risk event, click the delete icon next to its name.
Step 3 — Configure Task Correlations (Optional)
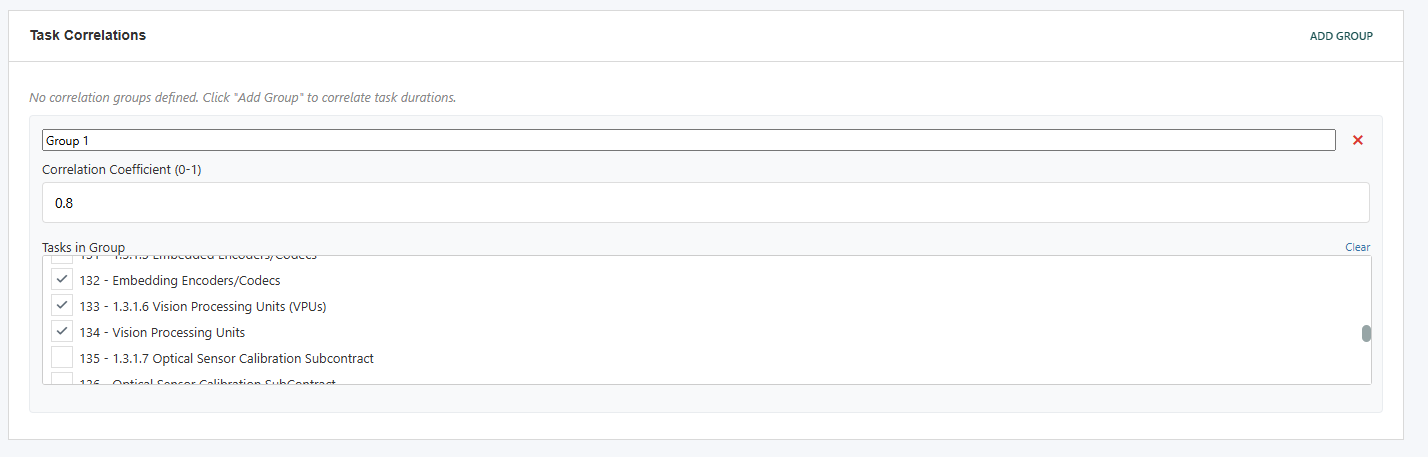
In real projects, tasks often share common risk factors — if one task runs late, related tasks tend to run late too. The Task Correlations panel lets you group tasks that should vary together.
Click Add Group to create a correlation group:
Field | Description |
|---|---|
Group Name | A descriptive name for the group (e.g. "Foundation Work") |
Correlation Coefficient (0–1) | How strongly the tasks in this group move together. 1.0 = perfectly correlated; 0 = independent. Default: 0.8 |
Tasks in Group | Checklist of tasks to include. Select at least 2 tasks. |
When tasks are correlated, the simulation ensures that if one task in the group samples a pessimistic duration, the others in the same group tend to as well (and vice versa).
Step 4 — Set Simulation Settings
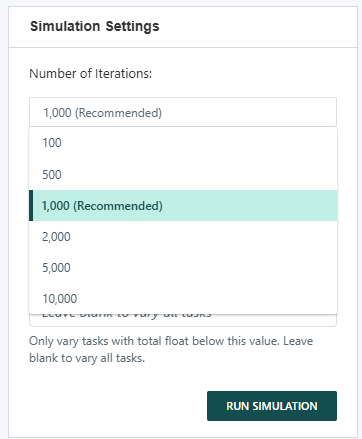
The Simulation Settings panel on the right sidebar controls how the simulation runs:
Setting | Description |
|---|---|
Number of Iterations | How many times to run the schedule. More iterations = more accurate results but longer run time. Options: 500, 1,000 (recommended), 2,500, 5,000, 10,000 |
Target Completion Date (optional) | Enter a specific date to calculate the probability of finishing on or before that date. Defaults to the current planned finish date. |
Float Threshold (days) (optional) | Only vary tasks whose total float is below this number of days. Tasks with high float have little impact on the finish date, so excluding them can focus the analysis. Leave blank to vary all eligible tasks. |
Step 5 — Save & Load Settings
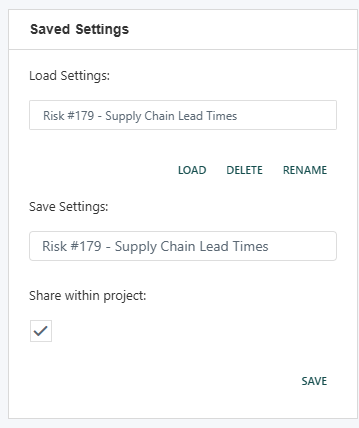
The Saved Settings panel on the right sidebar lets you preserve your entire simulation configuration — distributions, risk events, correlation groups, and all settings — so you can reuse them later or share them with colleagues.
Saving
- Enter a name in the Save Settings text box.
- Optionally tick Share within project to make the setting visible to all users with access to this project.
- Click Save.
If you save with the same name as an existing setting you own, it overwrites the previous version.
Loading
- Select a setting from the Load Settings dropdown.
- Click Load.
All task distributions, risk events, correlation groups, and simulation options are restored. Tasks that have been added to the project since the setting was saved receive default distributions based on the saved optimistic/pessimistic percentages. Tasks that have been removed from the project are silently ignored.
Note: Saved settings reference tasks by their internal database ID, not by their display order (
#column). This means settings remain valid even if tasks are reordered, added, or removed from the project.
Managing
- Rename: Select a setting you own, change the name in the text box, and click Rename.
- Delete: Select a setting you own and click Delete. A confirmation prompt appears before deletion.
- Only the owner of a setting can rename or delete it. Shared settings from other users can be loaded but not modified.
Step 6 — Run the Simulation
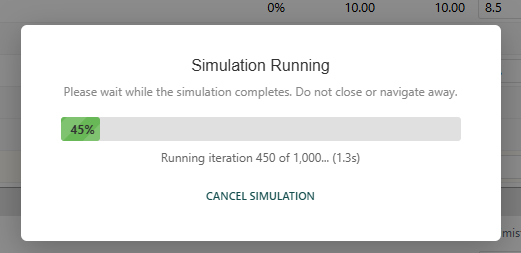
Click the Run Simulation button to start. A full-page overlay appears showing:
- A progress bar with percentage complete
A status message that moves through these phases:
- "Starting simulation…"
- "Running iteration 500 of 1,000…" (with elapsed time)
- "Calculating results…" — when all iterations are done and results are being aggregated
- "Processing results…" — when the server is sending results back to the browser
- A Cancel Simulation button if you need to stop early
Tip: Do not close the browser tab or navigate away while the simulation is running.
Typical run times:
- 1,000 iterations: a few seconds
- 10,000 iterations: up to 30 seconds (depending on schedule size)
If you cancel, no results are displayed.
Understanding the Results
Once the simulation completes, results appear in two places: the Simulation Summary sidebar and the Simulation Results panel below the configuration.
Simulation Summary (Sidebar)
The summary card shows the key outcomes at a glance:
Item | Description |
|---|---|
Project Start | The project start date used in the simulation |
Scheduled Finish | The current deterministic (planned) finish date |
P50 (Median) | The date by which 50% of simulations finished — there is a 50/50 chance of finishing by this date |
P80 | The date with 80% confidence — commonly used for commitments and reporting |
P90 | The date with 90% confidence — a conservative estimate |
Mean | Average project duration across all iterations (in days) |
Std Dev | Standard deviation of project duration — indicates how spread out the results are |
Task counts | Breakdown of total tasks, mother tasks, inactive, completed, zero-duration, and tasks varied |
Probability of meeting target | If you entered a target date, this shows the percentage chance of finishing on or before that date, displayed with a color-coded bar (green ≥ 80%, amber ≥ 50%, red < 50%) |

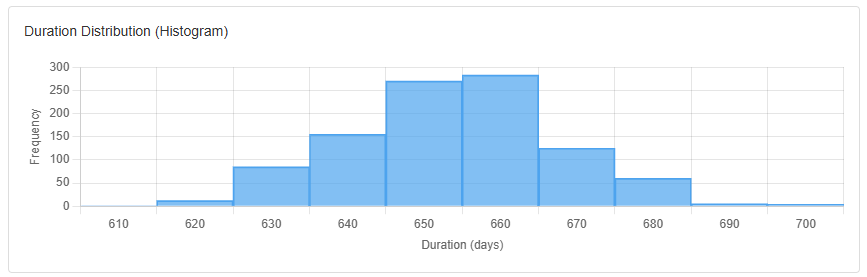
Duration Distribution (Histogram)
A bar chart showing how project finish dates are distributed across the simulation iterations. The x-axis shows finish dates and the y-axis shows how many iterations produced each date. This gives you a visual sense of the most likely finish date range.
- A tall narrow histogram means the finish date is fairly predictable.
- A wide spread histogram means there is significant schedule uncertainty.
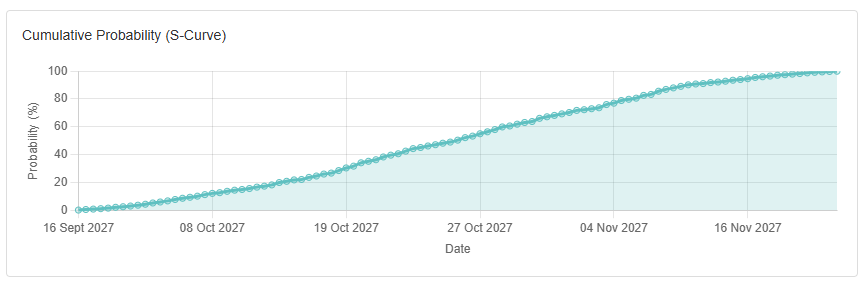
Cumulative Probability (S-Curve)
A line chart showing the cumulative probability of finishing by each date. Reading from left to right:
- Find your desired confidence level on the y-axis (e.g. 80%)
- Read across to the curve, then down to the x-axis to find the corresponding date
This is the most useful chart for answering "What date gives us X% confidence?"
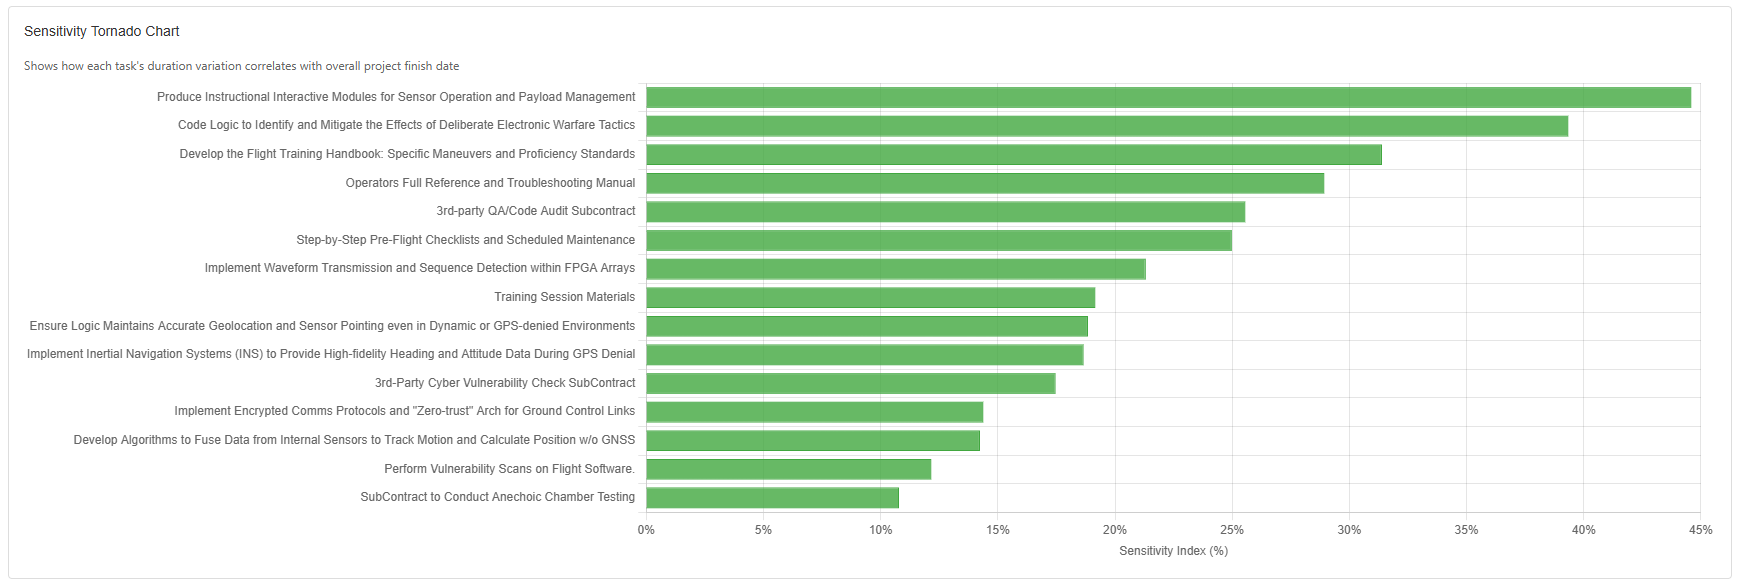
Sensitivity Tornado Chart
A horizontal bar chart showing which tasks have the greatest impact on the project finish date. Tasks are ranked by their Spearman rank correlation — a non-parametric measure of the relationship between each task's sampled duration and the overall project finish date. Spearman rank correlation is preferred over Pearson correlation because it captures monotonic (non-linear) relationships and is robust to outliers.
- Tasks at the top of the tornado chart are the biggest schedule drivers.
- Focus risk mitigation efforts on these tasks for the greatest benefit.
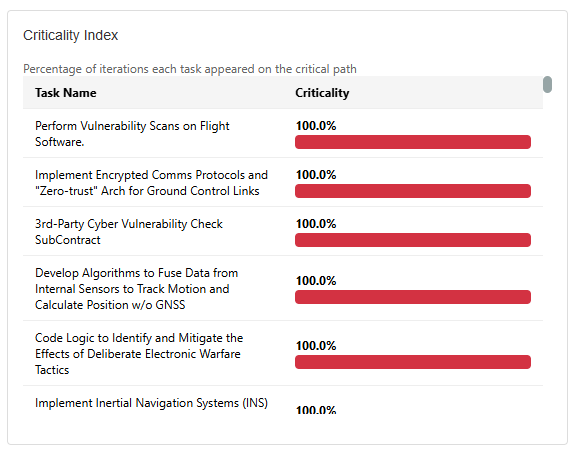
Criticality Index Table
A table showing the percentage of iterations in which each task appeared on the critical path. A task with 100% criticality was on the critical path in every iteration; a task with 30% criticality was on the critical path in 30% of iterations.
Column | Description |
|---|---|
Task Name | Name of the task |
Criticality | Percentage of iterations the task was on the critical path |
Tasks that are always critical (100%) are schedule-fixed. Tasks with high but not 100% criticality are "near-critical" and deserve attention.
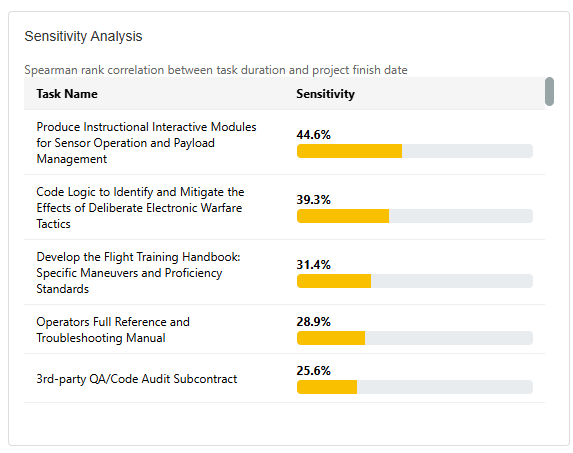
Sensitivity Analysis Table
A table showing the Spearman rank correlation between each task's sampled duration and the project finish date.
Column | Description |
|---|---|
Task Name | Name of the task |
Sensitivity | Correlation coefficient (−1 to +1). Higher positive values mean the task strongly influences the finish date. |
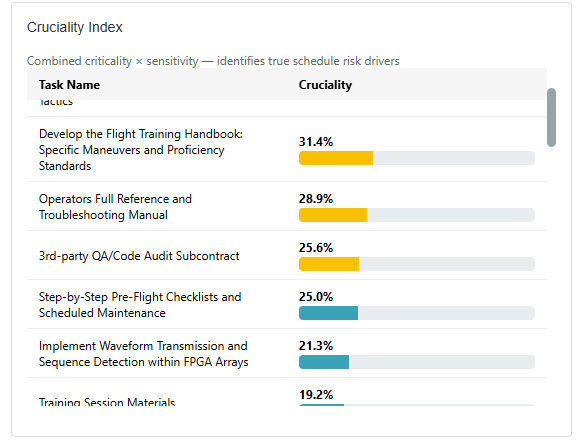
Cruciality Index Table
The Cruciality Index combines the Criticality Index and the Sensitivity Index into a single metric that identifies the tasks that are both frequently on the critical path and strongly influence the finish date:
Cruciality = Criticality (%) × |Spearman Sensitivity| ÷ 100
Column | Description |
|---|---|
Task Name | Name of the task |
Cruciality | Combined cruciality index (0–100%). Higher values indicate the most important schedule risk drivers |
Tasks with a cruciality index below 0.1% are filtered out. The remaining tasks are sorted from highest to lowest and displayed with color-coded bars:
- High (≥ 50%) — critical risk drivers requiring immediate attention
- Medium (≥ 25%) — significant contributors worth monitoring
- Low (< 25%) — minor contributors
The Cruciality Index is especially useful because a task can have high criticality (always on the critical path) but low sensitivity (its duration doesn't vary much), or vice versa. Only tasks that score high on both measures have a high cruciality — these are the true schedule risk drivers.
Risk Event Results Table
If you defined risk events, this table shows how they played out across the simulation:
Column | Description |
|---|---|
Risk Event | Name of the risk event |
Specified | The probability you assigned |
Actual Rate | The percentage of iterations where the risk actually occurred (should be close to the specified probability) |
Occurrences | Number of iterations in which the risk fired |
Avg Impact | Average delay (in days) caused when the risk occurred |
Impact Range | Minimum to maximum delay observed |

? Items to be aware of (Gotchas!)
Item | Admin, End User, or Both |
|---|---|
Project Profile - Users must be in a profile (Project Access) that allows full change access to the schedule (ie: Gantt) to be able to use this feature. | Both |
A schedule with a minimum of one task is required for this feature | End User |
Was this article helpful?
That’s Great!
Thank you for your feedback
Sorry! We couldn't be helpful
Thank you for your feedback
Feedback sent
We appreciate your effort and will try to fix the article