Registers: Dashboard Widget
The Register Widget in Cora PPM is a configurable dashboard widget that surfaces data from any Custom Register (a structured log used to track risks, issues, actions, changes, decisions, or any other custom record type) directly on a Project Dashboard, Executive/Strategy Dashboard, or My Dashboard.
- Register Widget - used on Project Dashboards and Executive/Strategy Dashboards. It shows records belonging to one or more projects and respects project-level profile rights.
- My Register Widget - used on My Dashboard. It shows records owned by the current user across all projects they have access to.
What the Widget Displays
Each Register Widget is linked to a specific Custom Register (e.g. "Risk Register", "Action Log") and can show up to three visual elements depending on its configured Widget Type:
- Summary (Donut/Pie/Bar/Tree Map/Matrix chart) — counts records grouped by a chosen field (e.g. Status, Priority). Clicking a segment filters the grid below to show only those records.
- Date Counters panel — shows how many records have a key date (e.g. Target Date, Last Updated) falling today, tomorrow, this week, or this month, plus overdue records.
Trend line chart — shows a month-by-month trend of record counts or a numeric field value over time.
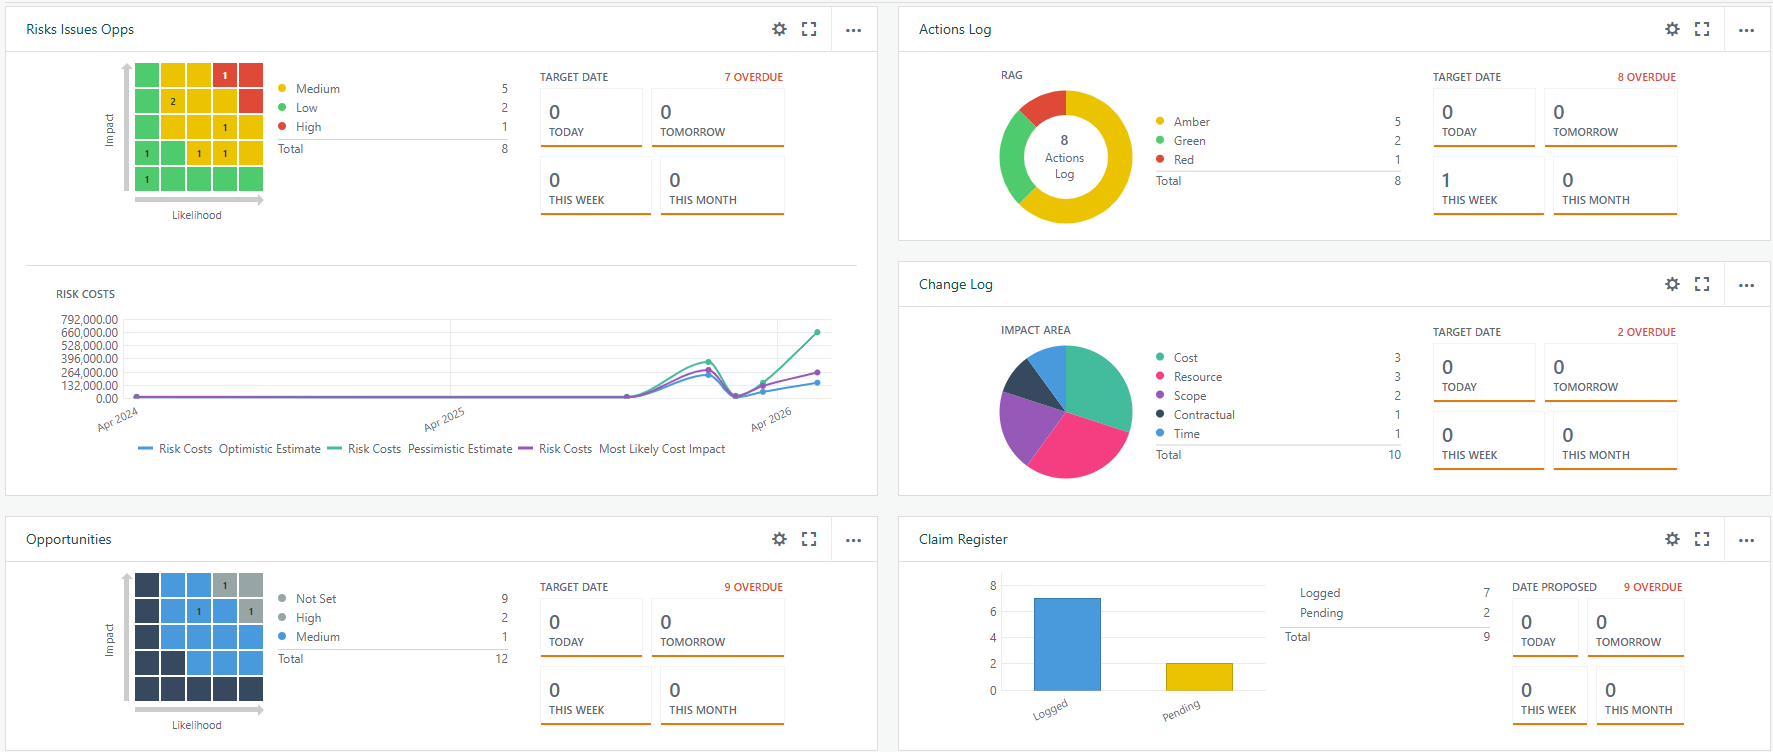
When a user clicks on the chart or counters, the widget expands to show the full data grid below the chart, filtered to the clicked segment. The grid lists all matching register records with every configured custom field as a column.
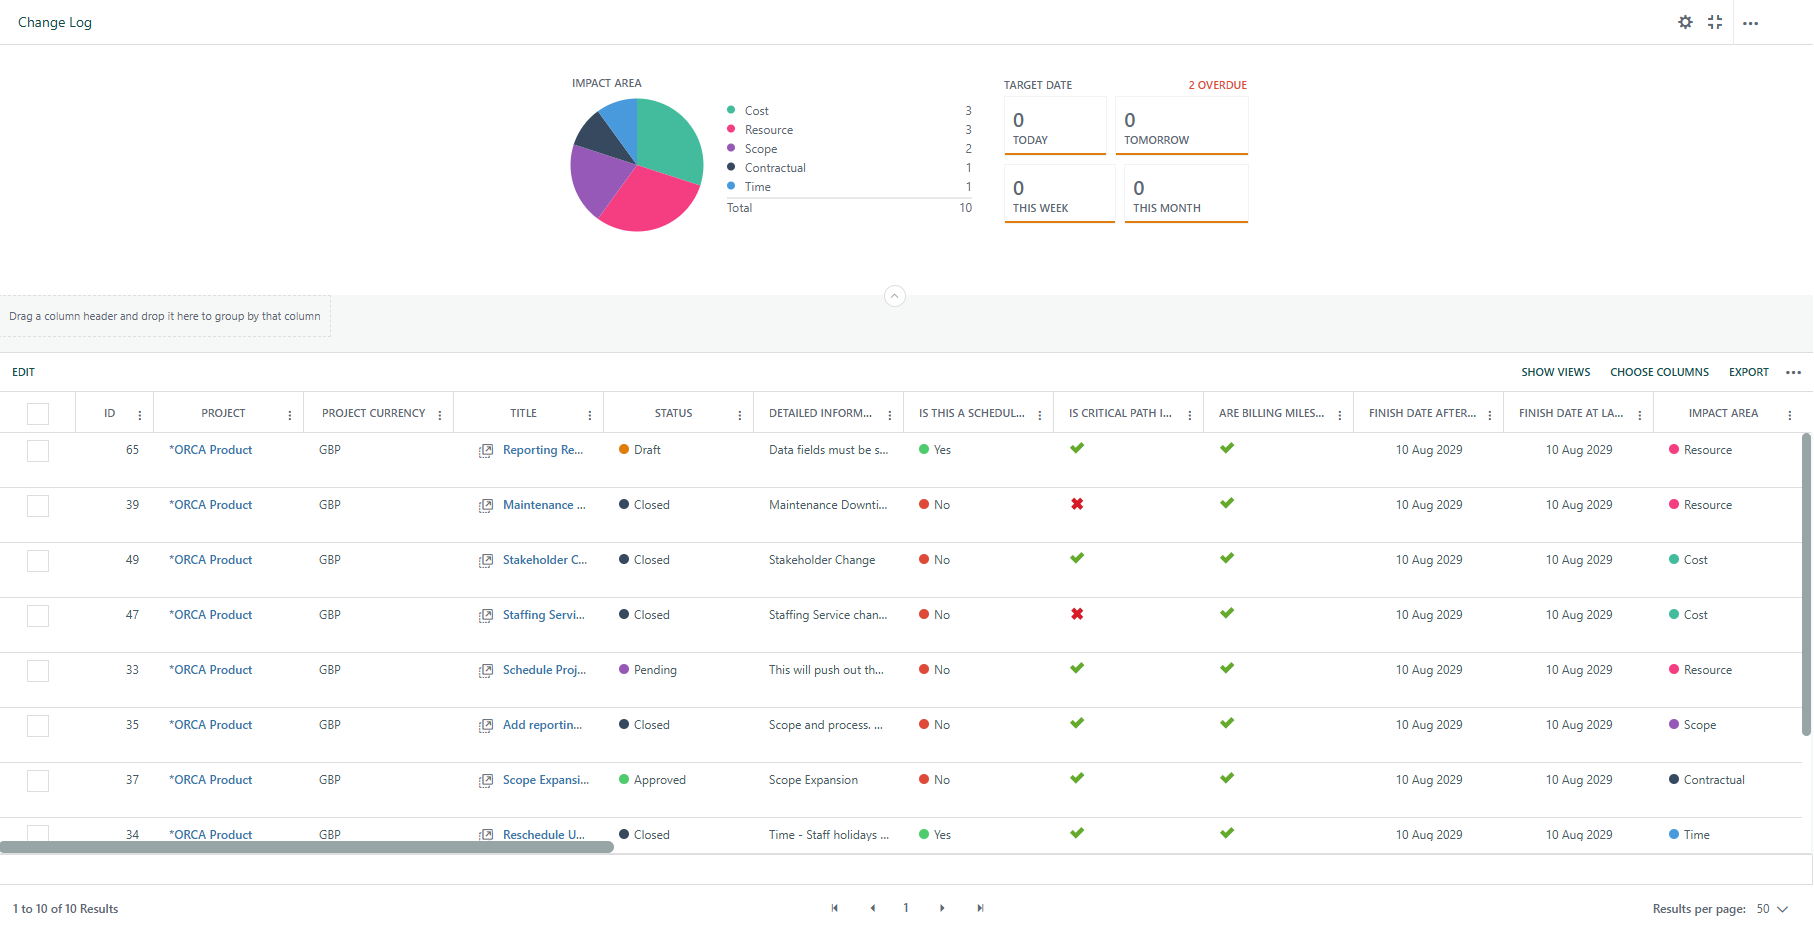
In-line Editing in the Widget Grid
When the widget grid is expanded, users can edit records in two ways:
- Clicking a record's Description cell - open the register on that project that record resides
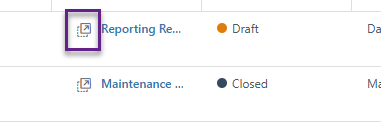
- Clicking the record’s popup button - opens the full record detail modal, a multi-tabbed panel with all fields, documents, comments, linked items, distribution, expenses, time, and workflow controls.
- In-line cell editing - if the Register has in-line editing enabled, users can click directly into certain cells (dropdown fields, text, dates, numbers, booleans) and update values without opening the modal.
Editing availability in the widget is subject to the user's profile rights for that register on that project (Can View, Can Add, Can Edit, Can Delete). Records that are locked (e.g. active in a workflow) show a padlock icon and cannot be edited inline or via the modal save action. Records in a Closed status can be re-opened using the close/re-open toggle button.
Adding and Configuring the Widget
The Administrator controls whether a widget is available for a register, which dashboards it appears and which users have access to the widget.
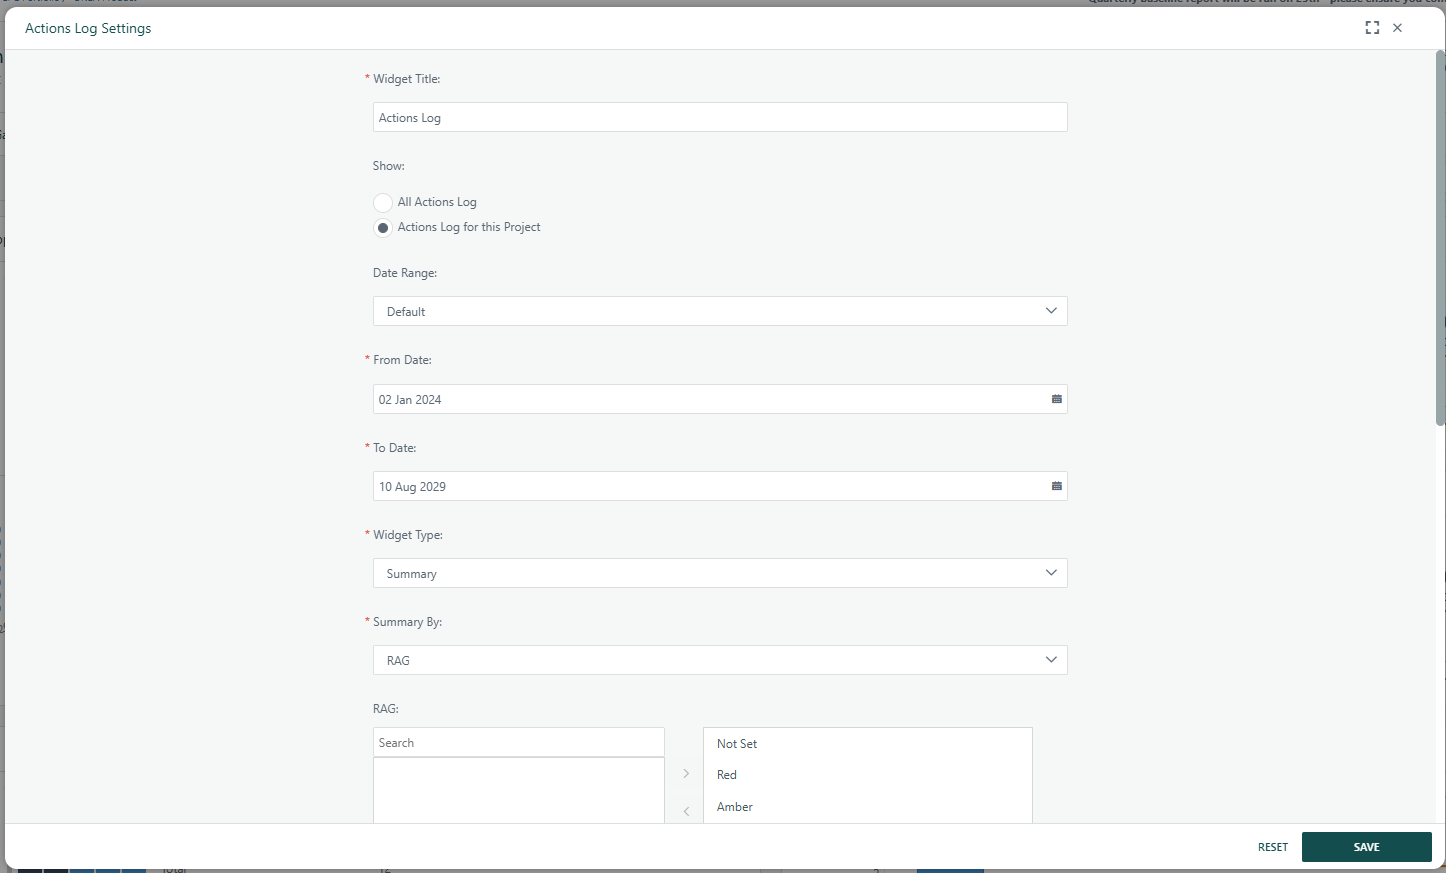
Each instance of the widget requires a Settings configuration where the administrator chooses:
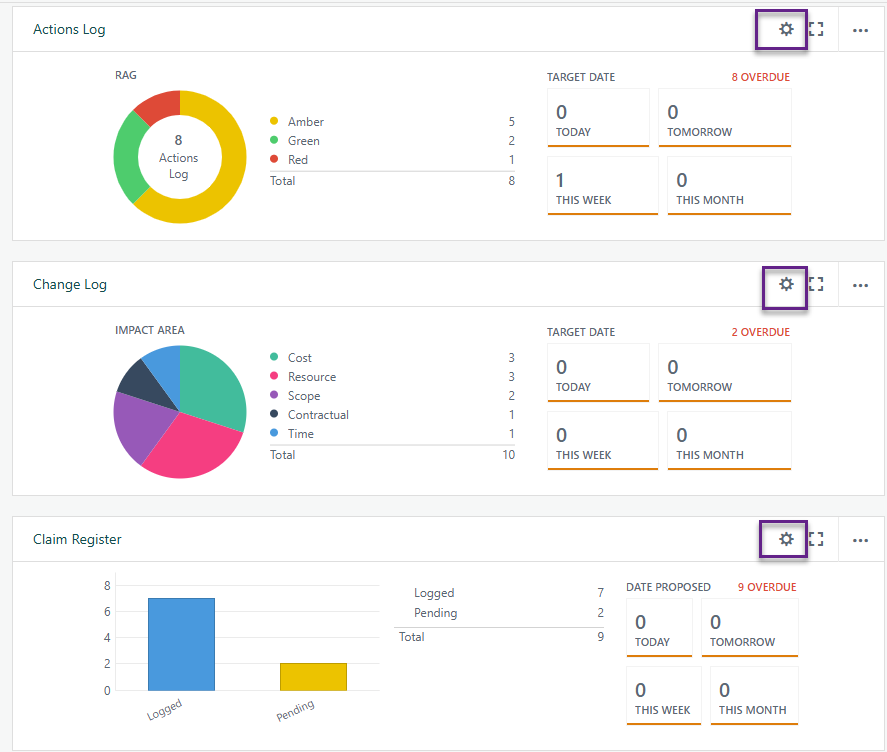
- Widget title, the Register to display, whether to include sub-project data, and the date range.
- Widget Type: Summary only, Trend only, or Summary + Trend.
- The donut chart field (the field to group by in the chart), which status/list values to include, and the display order.
- The date counter field (the date field driving the Today/Tomorrow/Week/Month counters).
- For trends: trend name, trend type (Count or Column Value), trend by date, and columns to plot.
- Chart Type: Donut, Pie, Bar, Tree Map, or Register Matrix.
- An optional filter query to pre-filter the records shown.
- An optional abbreviation setting for large numbers on the chart axis.
Was this article helpful?
That’s Great!
Thank you for your feedback
Sorry! We couldn't be helpful
Thank you for your feedback
Feedback sent
We appreciate your effort and will try to fix the article