GovCon: EAC Analysis
An EAC analysis—Estimate at Completion analysis—is a project management technique used to forecast the total expected cost of a project based on current performance.
How to Use This Function or Component (End User)
Before generating an EAC analysis, ensure the following conditions are met:
- The Status Date is set
A current, active, and approved baseline exists for:
- PMB (Performance Measurement Baseline)
- MTH (Monthly Time-Phased Baseline)
- ETC (Estimate to Complete Baseline
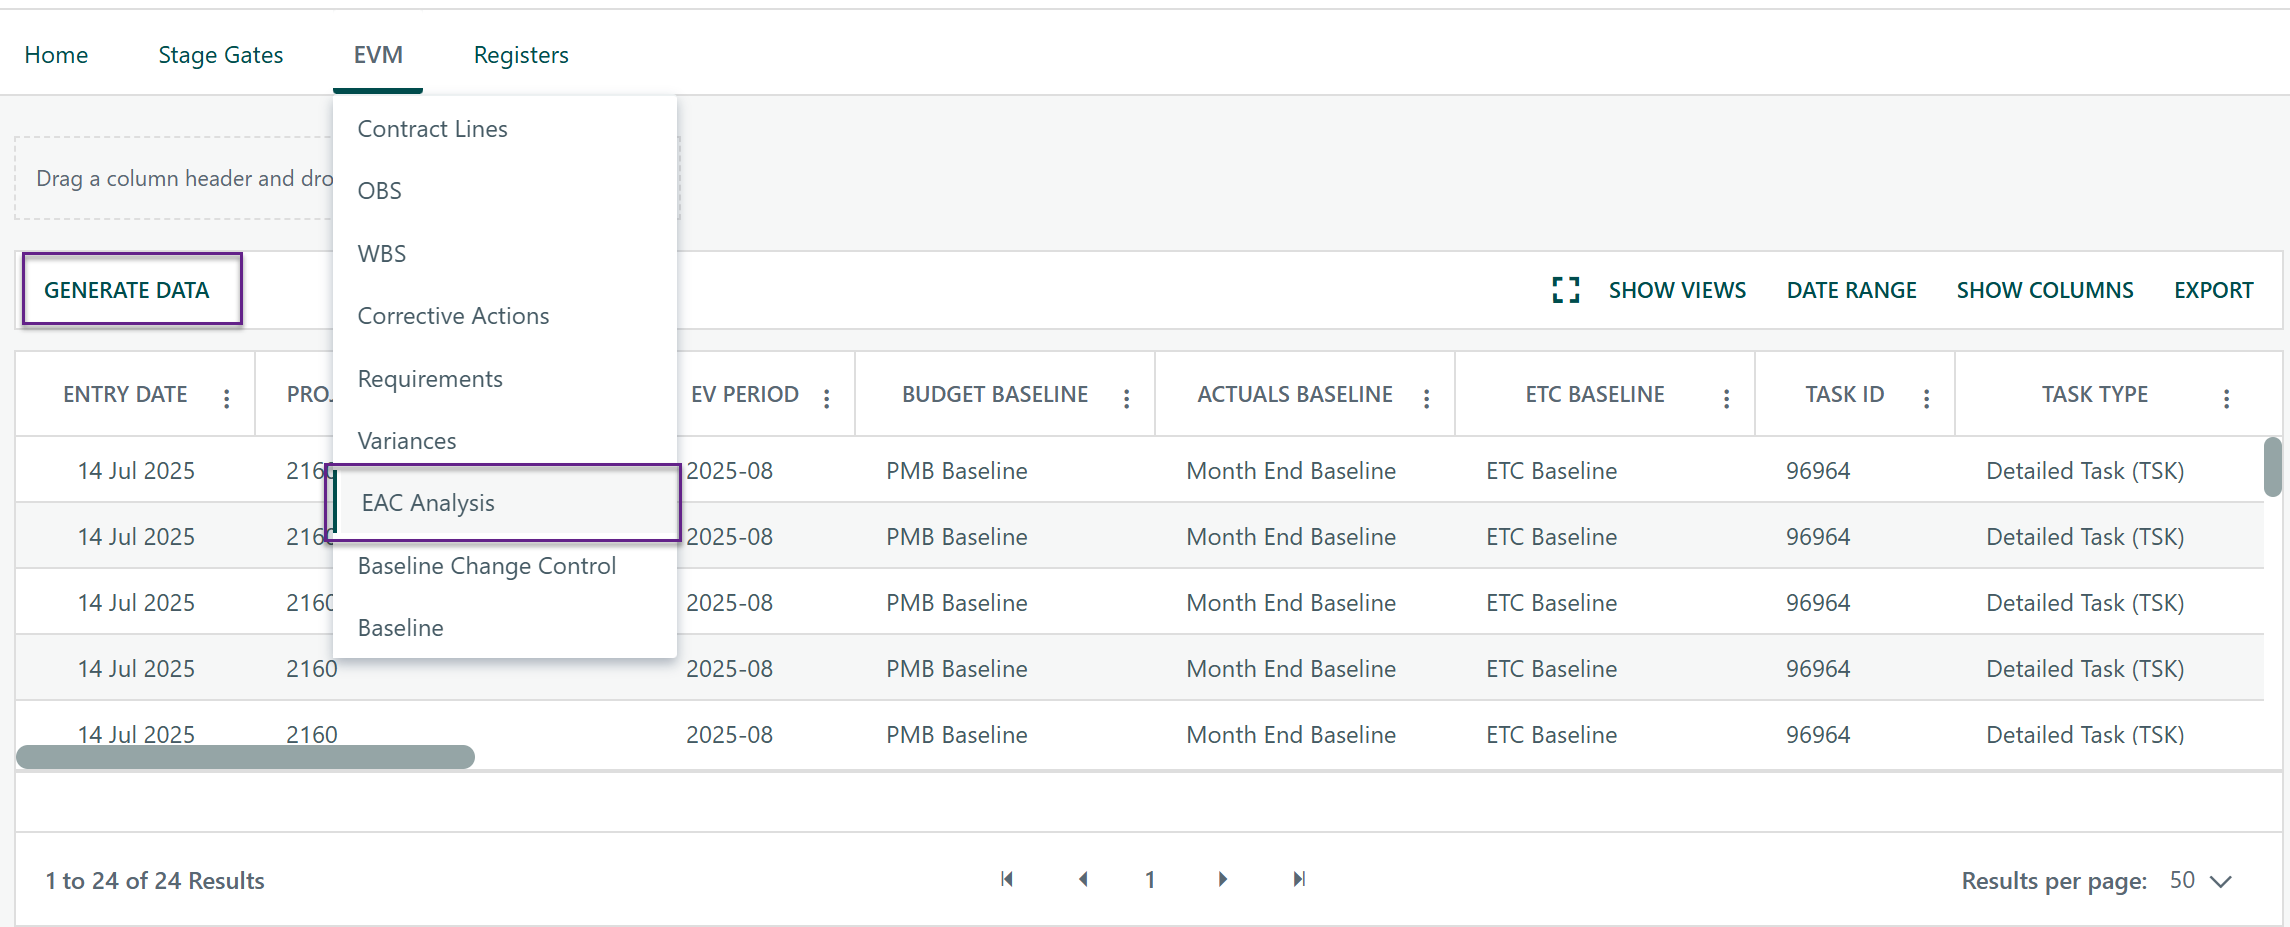
- Navigate to the EAC Analysis functionality on the project toolbar
- Click Generate Data
EV period data will populate based on the three baselines for the current reporting period
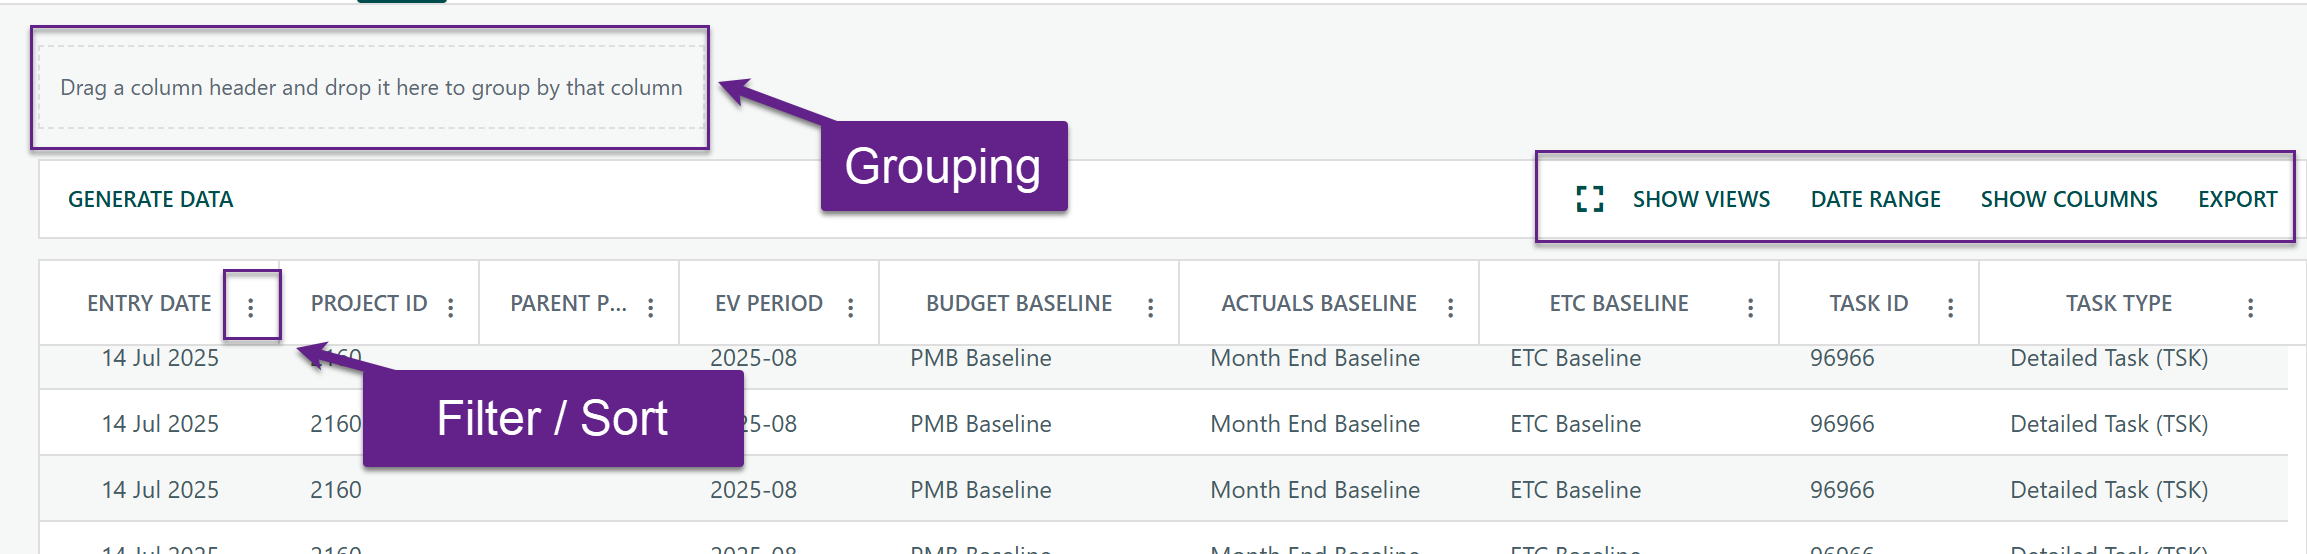
Similar to the Register, users can customize their view using the following features:
- Column Kabob Menu: Use the three-dot menu on each column header to filter and/or sort data within that column
- Date Range Selector: Choose a specific period to display relevant data
- Show Columns: Customize the view by displaying only the most relevant data
- Export to Excel: Download data for sharing with non-Cora users
- Save Views: Save customized views (filters, columns, and layout) for quicker access in the future
- Expand Screen: Maximize the screen to reduce scrolling and view more data at once
Group Data by dragging and dropping column headers to organize and view information in different ways.
Understanding the Data on EAC Analysis
What the page shows
EAC Analysis is the raw, unrolled view of a project’s earned-value dataset for a reporting period — the numbers behind the EVM reports, at the finest grain Cora stores them.
Everywhere else in Cora, earned-value figures arrive pre-assembled: BCWS, BCWP, ACWP, ETC, CPI. This page shows the layer underneath. Every cost and hour that Cora time-phased for the period is listed as its own line, tagged with which task it belongs to, when it falls relative to the status date, what kind of value it is, and what kind of resource produced it.
That makes it the right page for three jobs:
- Reconciling a number. When a CPI or a variance looks wrong, this is where you find the lines that produced it.
- Slicing beyond the standard reports. Group by Control Account, Task Type, or Resource Type to answer questions the fixed reports don’t.
- Extracting for an external submission. Export the period to Excel with exactly the columns you need.
The page never calculates on the fly. You generate a dataset for a period, and from then on the grid reads that stored snapshot — including the identity of the three baselines it was built from, so the numbers stay defensible after the plan moves on.
Before you start
You need a project in context
The page reports on whichever project is currently selected. Open it without one and it shows “Please select a project.” Pick a project first, then return.
You need the view right
Access is controlled by the project security right User can view EAC Analysis page. Without it the grid is hidden entirely and the page shows “You do not have sufficient rights to access this page.” Your Cora administrator grants this per security profile.
Worth knowing
There is no separate right for generating data. Anyone who can view the page can also run Generate Data, which rebuilds the project’s dataset for the current status period. Bear that in mind when granting the right.
Generating the Data
An empty grid usually means nobody has generated a dataset for the period yet — not that the project has no data.
The Four Preconditions
Click Generate Data in the grid toolbar and Cora opens the Generate EAC Analysis Data dialog. It runs four checks against the project and shows each as Completed or Not Completed. Confirm stays disabled until all four pass.
- ✓A Status Date has been set on the Gantt. This is what defines the reporting period — everything on the page is measured relative to it.
- ✓A current, active, approved PMB baseline exists. Supplies the budget (BCWS) and the baseline dates.
- ✓A current, active, approved MTH baseline exists. Supplies actuals, earned value, progress percentages and actual/early dates.
- ✓A current, active, approved EAC baseline exists. Supplies the forecast (ETC) and the forecast dates.
If a check fails, fix it in the project — set the status date, or approve the missing baseline — and reopen the dialog.
What Confirm Does
Confirm builds the dataset for the project’s current status period only, derived from the status date. You cannot choose a different period from this page. In order, Cora:
- Discards any existing unfinalized dataset for that project and period.
- Records the snapshot header — period, status date, and the three baseline IDs in force.
- Loads the project’s tasks, with their WBS, OBS and Control Account Manager details from the WBS register.
- Time-phases actual, budget, earned and forecast costs against those tasks, tagging each by period.
- Aggregates the stored EVM metrics and refreshes the calculated EVM variance values used elsewhere in Cora.
You’ll then see one of three messages:
Message | What it means |
|---|---|
EAC Data Generated | The dataset was built and the grid has been refreshed with it. |
EAC Data Generated zero records | Generation succeeded, but produced no non-zero lines. See Troubleshooting — usually the tasks aren’t cross-referenced in the WBS register, or the baselines carry no time-phased cost. |
EAC Data Generation failed | Generation was rejected or errored. The most common cause is a finalized dataset already existing for that project and period, which Cora will not overwrite. A missing PMB, MTH or EAC baseline will also stop it. |
Regeneration replaces
Running Generate Data again for the same period rebuilds that period’s dataset from scratch — it does not add a second version alongside the first. Earlier periods are untouched, so the historic record is safe, but the current period’s figures will move if the schedule or baselines have changed since the last run.
What a Row Is
This is the single most important idea on the page. A row is not a task, and it is not a resource. It is one slice of money.
Each row is the total Cost and Hours for one unique combination of four things:

So a single task typically produces several rows — one for each combination that has a value. Everything else on the row (dates, percentages, WBS, Control Account, rate matrix) describes the task and repeats identically across all of that task’s rows. Only Cost and Hours vary with the three dimension columns.
Three consequences
- Zero rows are omitted. If a combination has no cost and no hours, it isn’t written at all. A missing row means zero — not missing data.
- There is no “Total” resource type row. Totals come from the grid’s own group footers, not from a pre-summed line. Every row is Skill, Material, Facility or User.
- Nothing is rolled up the hierarchy. A Control Account row carries only the cost attached directly to that task, not the sum of its work packages. Sum across the rows to get a subtotal — don’t read a summary task’s row as its subtree total.
The Three Dimensions
Cumulative Level — when the money falls
Cora assigns this by comparing the period each cost sits in against the project’s status period.
Value | Periods included | Read it as |
|---|---|---|
Cumulative | Everything up to and including the status period | Inception-to-date (ITD). This is the figure to use for CPI, SPI, cumulative variances and EAC. |
Current | The status period only | This month’s movement. Use for current-period variances. |
Forecast | Every period after the status period | Work still to come. With Data Category = Forecast, this is your ETC. |
Do Not Add These Together
Cumulative already contains Current. Cora folds the current period into the cumulative figure when it builds the dataset. Summing a Cumulative row and a Current row for the same task double-counts the status month. If you group the grid by Cumulative Level, treat each group’s total as a separate answer, never as a component of a grand total.
Data Category — what kind of value it is
Value | Sourced from | Meaning |
|---|---|---|
Budget | PMB baseline | Authorised budget for the work as scheduled — the planned value (BCWS / PV). |
Earned | MTH baseline | Budget credited for work actually accomplished — earned value (BCWP / EV). |
Actual | MTH baseline actuals | Cost genuinely incurred — actual cost (ACWP / AC). |
Forecast | EAC baseline | The current estimate. In future periods this is the ETC; in past periods it’s the forecast profile for work already remaining. |
Resource Type — What Produced the Cost
Every line is attributed to one of four resource kinds: Skill, Material, Facility or User. Costs that arrive without an identifiable resource — imported actuals against an account code, for instance — are classified as Material.
Reading EVM Metrics Out of the Grid
Cross Cumulative Level with Data Category and you get the standard earned-value measures. This is exactly how Cora derives its own stored metrics — the grid and the reports agree by construction.
Data Category | × Cumulative / ITD | × Current Period | × Forecast |
|---|---|---|---|
Budget | BCWS cumPlanned value to date | BCWSPlanned value this period |
|
Earned | BCWP cumEarned value to date | BCWPEarned value this period |
|
Actual | ACWP cumActual cost to date | ACWPActual cost this period |
|
Forecast | BCWR cumBudgeted cost of work remaining |
| ETCEstimate to complete |
Everything else follows from those six
Cora computes the headline metrics from the cells above. Where a denominator is zero, Cora returns 0 rather than an error.
BAC | BCWP cum + BCWR cum Budget at completion |
EAC | ACWP cum + ETC Estimate at completion |
VAC | BAC − EAC Variance at completion |
CV | BCWP − ACWP Cost variance, current period |
CV cum | BCWP cum − ACWP cum Cost variance to date |
SV | BCWP − BCWS Schedule variance, current period |
SV cum | BCWP cum − BCWS cum Schedule variance to date |
CPI | BCWP cum ÷ ACWP cum Cost performance index |
SPI | BCWP cum ÷ BCWS cum Schedule performance index |
TCPI (BAC) | (BAC − BCWP cum) ÷ (BAC − ACWP cum) To-complete index against budget |
TCPI (EAC) | (BAC − BCWP cum) ÷ (EAC − ACWP cum) To-complete index against estimate |
In Practice
To get, say, cumulative CPI for a Control Account: filter to the tasks in that account, group by Data Category, restrict to Cumulative rows, and read the Earned and Actual group totals of the Cost column. CPI is the first divided by the second
Column Reference
Thirty-eight columns, of which four are hidden by default. Use the column chooser in the grid toolbar to switch any of them on or off.
Snapshot identity
These describe the generated dataset itself, and are identical on every row from the same run.
Column | What it holds |
|---|---|
Entry Date | When this dataset was generated. Your evidence of how current the figures are. |
Project ID | The project the snapshot belongs to. |
Parent Project ID | The parent project, where this project is linked into a programme. |
EV Period | The reporting period, as |
Budget Baseline | Description of the PMB baseline the budget figures came from. |
Actuals Baseline | Description of the MTH baseline the actuals and earned figures came from. |
EAC Baseline | Description of the EAC baseline the forecast figures came from. |
Task Identity and Structure
Column | Source | What it Holds |
|---|---|---|
Task ID | Schedule | The task this line of cost belongs to. |
Task Type | Task type register | Summary, Control Account, Work Package, Planning Package, Detailed Task, Milestone, and so on. |
EV Technique | EVM setup | The earned-value technique code assigned to the task — for example |
Apportioned Tasks | EVM setup | For apportioned-effort tasks, the list of task IDs the effort is apportioned against, as |
Control Account | WBS register | The WBS number — populated only when the task is itself a Control Account. Blank on every other task type. |
Work Package | WBS register | The WBS number — populated only when the task is itself a Work Package. |
WBS Code | WBS register | The WBS number — populated only when the task is a Summary task. See the note below. |
Control Account Manager | WBS register | The CAM recorded against the task’s WBS entry, shown as a username. |
OBS Code | OBS register | The organisational breakdown code linked to the task’s WBS entry. |
Rate Matrix Version | MTH baseline | Name of the rate matrix version used to cost the task. |
Rate Matrix Description | MTH baseline | The matrix description and version, combined — for example |
Control Account / Work Package / WBS Code
These three are not a hierarchy path — they are the same WBS number, revealed in whichever column matches the task’s own type. Any given task fills exactly one of the three; the other two are blank. To see the WBS number regardless of task type, show all three and read across, or group by Task Type first.
Dates
Each pair of dates comes from a different baseline, which is what makes plan, actual and forecast comparable on one row.
Column | Source | What it holds |
|---|---|---|
Baseline Start / Finish Date | PMB baseline | The task as originally planned in the performance measurement baseline. |
Actual Start / Finish Date | MTH baseline | When the task actually started and finished. Blank where not yet started or finished. |
Forecast Start / Finish Date | EAC baseline | The current forecast dates for the task. |
Early Start / Finish Date | MTH baseline | Early dates from the schedule calculation, for float and critical-path context. |
Progress
All four come from the MTH baseline, so they are the values as at the snapshot rather than today’s. All are excluded from the grid’s automatic totaling — percentages don’t sum.
Column | What it holds |
|---|---|
Percent Complete | The task’s headline progress figure. |
EV Percent Complete | Progress as claimed by the task’s earned-value technique — this is what drives BCWP. |
Physical Percent Complete | Progress assessed against physical deliverables or units. |
Duration Percent Complete | Elapsed duration as a proportion of total duration. |
The Measure
Column | What it holds |
|---|---|
Resource Type | Skill, Material, Facility or User. See The three dimensions. |
Cumulative Level | Cumulative, Current or Forecast. |
Data Category | Budget, Earned, Actual or Forecast. |
Cost | The money for this combination, in the project’s currency, to two decimal places. Totalled in group footers. |
Hours | The effort for this combination. Totalled in group footers. Read the caveats in What catches people out before relying on it. |
Hidden by Default
Column | What it holds |
|---|---|
Task Resource ID | Always empty on this page. The grid aggregates individual resource lines away before displaying them, so these three identifiers have nothing to show. They exist in the underlying dataset — reach them through the EV Period Data API or a report built on it, not here. |
Burden Subcategory | |
Element of Cost | |
Parent Project ID | Visible by default, but blank on standalone projects. |
Working with the Grid
Choosing Which Periods You See
By default the grid shows the latest period only — the dataset matching the project’s current status date.
To see history, open the date range control from the grid toolbar and pick a From and To date. Cora then walks the range one month at a time, pulls each month’s dataset, and merges them into a single grid. Months with no generated dataset are skipped silently — no error, they simply aren’t there. A chip in the top-right corner shows the active range; the small × on it clears the range and returns you to the latest period.
Multi-Period Totals
When several periods are on screen, Cumulative rows do not add up across them — each month restates the same inception-to-date figure. For a multi-period trend, group by EV Period and compare the groups. Only Current rows are safe to sum across periods.
Grouping and Totals
Drag any column header into the group panel above the grid to group by it — stack several for a nested breakdown, such as Control Account → Data Category → Resource Type. Group footers total the Cost and Hours columns automatically. The four percentage columns are deliberately excluded from totaling. Use the un-group button to clear a level.
Columns and Layout
- Column chooser in the toolbar switches columns on and off, including the hidden ones.
- Drag headers to reorder columns; your arrangement is retained as you page and group.
- Headers stay fixed while the rows scroll, so the dimension columns remain readable deep into a long dataset.
- Expand (the arrows at the right of the toolbar) hides the page header and project banner and gives the grid the full window. Click again to restore.
Exporting
The export button produces an .xlsx file named EacAnalysis, containing the data without grid formatting. Cora confirms with “Your file will be available shortly”; if the grid is empty you’ll get “No records to export” instead.
Set the grid up before you export, not after: switch on any columns you need, apply the date range you want, and remove grouping you don’t want carried into the file.
What Catches People Out
Six behaviors that are correct by design but surprise people reading the grid for the first time.
Actual rows have no hours: Data Category = Actual carries Cost only; its Hours are always zero. Actuals reach Cora as monetary values against tasks, not as effort. Don’t derive an actual hourly rate from this page. | Burden lines carry cost without hours: Where burden or indirect subcategories apply, those lines contribute Cost but zero Hours. So an Hours total can legitimately understate the effort implied by the matching Cost total. |
Cumulative includes the current period: Cora folds Current into Cumulative during generation. Adding the two double-counts the status month. Compare them; never combine them. | Nothing is rolled up: Summary, Control Account and Work Package rows show only cost attached directly to that task. Subtotals come from grouping the grid, not from reading a parent’s row. |
Tasks must be in the WBS register: Only tasks cross-referenced in the WBS register — or whose parent is — make it into the dataset. A task missing from the grid is usually missing from the register, not missing cost. | Actuals depend on a system setting: Actual costs are only loaded when the system’s task actuals source is configured. If every Actual row is absent across the whole project, check that setting with your administrator before hunting for data problems. |
Troubleshooting
What you see | Why | What to do |
|---|---|---|
“Please select a project” | The page opened with no project in context. | Select a project, then return to EAC Analysis. |
“You do not have sufficient rights” | Your security profile lacks the view EAC Analysis page project right. | Ask your Cora administrator to grant it on your profile. |
Grid is empty | No dataset has been generated for the period in view. | Clear any date range first — then run Generate Data. For historic months, data only exists if it was generated at the time. |
Confirm is greyed out | One or more of the four preconditions is Not Completed. | Read which check is red. Set the Gantt status date, or get the missing PMB / MTH / EAC baseline approved and made current. |
“EAC Data Generated zero records” | The dataset built, but every line came out zero — or no lines were eligible at all. | Check that the project’s tasks are cross-referenced in the WBS register, that resources are assigned, and that the baselines hold time-phased cost. |
“EAC Data Generation failed” | Most often a finalized dataset already exists for this project and period, which cannot be overwritten. A baseline that has since stopped being current will also stop it. | If the period is finalized, that is deliberate — the figures are locked. Otherwise re-check the baselines, then retry. |
Months missing from a date range | No dataset was ever generated for those months. | Nothing to recover — generation is anchored to the status date, so past periods can’t be built retrospectively. Generate each period as it closes. |
“No records to export” | The grid holds no rows. | Resolve the empty grid first; the export only writes what the grid currently holds. |
Figures moved since last week | Someone regenerated the current period after a schedule or baseline change. | Check the Entry Date column, and the three baseline description columns, to see exactly which run and which plan you are looking at. |
A habit worth forming
Generate the dataset as part of closing each reporting period, immediately after the status date is set and the baselines are approved. The page can only ever build the current period, so a month that closes without a generation run leaves a permanent gap in the history.
? Items to be aware of (Gotchas)
Item | Admin, End User, or Both |
|---|---|
The Status Date is set
| End User |
EAC Analysis data can only be generated for the current period. If a prior period was not generated, the system cannot go back and generate. | End User |
Was this article helpful?
That’s Great!
Thank you for your feedback
Sorry! We couldn't be helpful
Thank you for your feedback
Feedback sent
We appreciate your effort and will try to fix the article