Capacity Insights: Portfolio, Resource & Project Insights Dashboards
Overview: Cora PPM's Capacity module includes three related analytics screens that compare demand for people against what is available, requested, or approved.
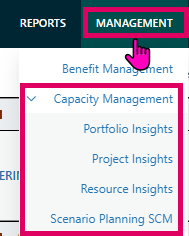
- Portfolio Insights — everything you have access to, with full charts and drill-down into any project or resource.
- Project Insights — a lightweight, chart-free project list filtered by resourcing department/organization and visibility.
- Resource Insights — scoped to one or more disciplines, with demand and trend charts plus manager-level filtering.
Key difference from Scenario Planning: Scenario Planning lets you rehearse a hypothetical future by editing a disposable copy of the plan. Insights screens show the real, current state of demand, requests, and approvals.
Why Customers Use Them
- Spot resource gaps before they escalate. See every discipline that is short or over-supplied.
- Find where demand for a scarce discipline concentrates. Demand charts break total demand down by skill.
- Catch resourcing that was requested but never approved. Requested-vs-Approved views surface uncommitted resourcing.
- Give managers self-service visibility. Managers can filter to their own people and trend.
- Track whether a gap is getting better or worse. Resource Gap Trend (%) shows direction over time.
- Drill from headline number to driver. Portfolio Insights links headline gaps to the project or resource behind them.
Choosing the Right Screen
All three screens use the same underlying data. What differs is scope and charting depth.
Portfolio Insights | Project Insights | Resource Insights | |
|---|---|---|---|
Scope | Everything you have access to | Projects under a resourcing department/organization | One or more disciplines |
Best For | Finding a gap anywhere in the portfolio, then drilling to the driver | A quick, no-frills list of projects and headline figures | Discipline-specific demand and trend, including a manager's own team |
Charts | Demand, Trend, Resource Utilization, Approved Resources | None | Demand, Trend, Approved Resources by Project |
Grids | Projects and Resources, both with drill-down | Projects only, no drill-down | Projects and Resources, no drill-down |
Distinctive Filters | Organizations, Project, Disciplines, Managers, Advanced Filtering | Resourcing Department or Organization, Projects To Display | Resourcing Department or Organization, Disciplines, Managers |
None of the three grids support column sorting or paging. Use filters to keep result sets manageable.
Common Use Cases by Project Environment
The screens answer the same question everywhere: where is real demand outrunning real capacity right now?
Manufacture-to-Order ?
- Cross-order discipline contention — use Resource Insights or Portfolio Insights filtered to a discipline.
- Approved-vs-Requested gaps — use Project Insights to catch unapproved resourcing.
- Utilization outliers — use Portfolio Insights' Resource Utilization chart.
Pharma ?
- Regulatory/QA discipline load — view total demand across live submissions in Resource Insights.
- Trend before it is a crisis — use Resource Gap Trend (%) in Resource or Portfolio Insights.
- Drill straight to the driver — use Portfolio Insights to jump to the exact trial or project.
Capital / EPC Projects ?️
- Portfolio-wide engineering discipline demand — use Portfolio Insights.
- Long-lead specialist tracking — use Resource Insights over a long date window.
- Phase-gate prep — use Portfolio Insights drill-down before stage-gate review.
GovCon ?️
- Cross-contract discipline utilization — use Resource Insights or Portfolio Insights filtered to the cleared-labor pool.
- Approved vs. Requested mapped to funding — use Project Insights.
- Manager-level self-service — use Resource Insights or Portfolio Insights.
Acronyms & Terms
Defined once here so the step-by-step guides below can use these terms freely.
Term | Stands For | What It Means Here |
|---|---|---|
PPM | Project Portfolio Management | Managing a set of projects as a single portfolio rather than in isolation. |
DMD | Demand | Resource requirement generated for a discipline in a given period. |
ALO | Allocated | Resourcing that has been assigned, whether or not formally approved. |
REQ | Requested | Resourcing that has been asked for but not yet approved. |
APP | Approved | Resourcing that has been formally signed off. |
GAP | Gap | The shortfall or surplus between demand and allocated/approved capacity. |
AVI | Available | Remaining, unallocated capacity. Some configurations label this |
CAP | Capacity | Total capacity for a discipline and period, if enabled. |
VDMD | Virtual Demand | Estimated or placeholder demand not tied to a firm booking. |
VCAP | Virtual Capacity | Capacity considered against virtual or placeholder demand. |
Resourcing Department | — | The on-screen label for what the system internally calls Strategy. |
Prime Resource Manager | — | The manager a resource formally reports to for resourcing purposes. |
Before publishing internally: grid labels are pulled from your organization's configured translations. Confirm the exact wording in your environment.
Using Portfolio Insights
Use Portfolio Insights when you need the fullest view: charts, grids, and drill-down.
Setup and Filtering
1. Set the Analysis Window
- Pick Month From.
- Pick Month To.
- Click GO.
2. Scope by Organization and Project
- Use Organizations if your resource model supports it.
- Use Project to include specific projects or leave blank for all accessible projects.
- Click GO.
3. Filter by Discipline, Manager, or Strategy
- Use Disciplines to narrow by skill.
- Use Managers to scope to specific Prime Resource Managers.
- Use Filter or Advanced Filtering for deeper project hierarchy or custom-field filtering.
Read the Results
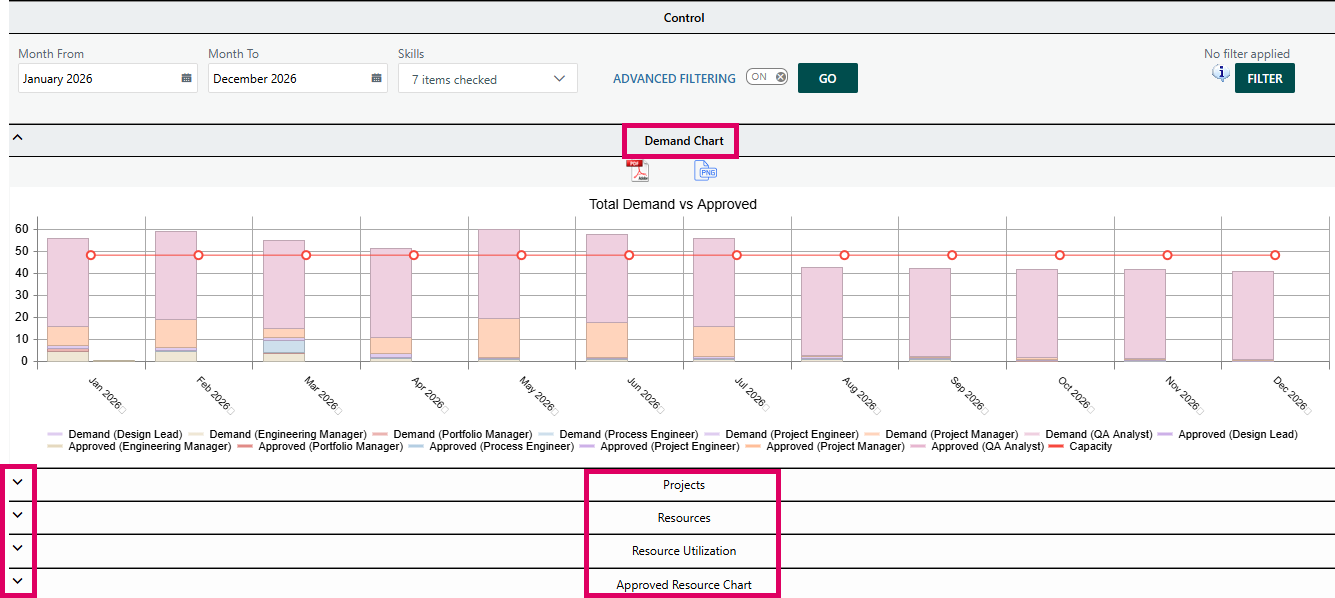
4. Demand Chart
Read stacked bars as monthly demand and approved resourcing by discipline. Use the Capacity line and legend toggles to isolate the key signal.
5. Trend Chart
Use Resource Gap Trend (%) to see whether gaps are improving or worsening over time.
6. Resource Utilization Chart
Use utilization buckets to find over-allocated or underused individuals.
7. Approved Resources Chart
Review approved-resource counts by month.
8. Projects and Resources Grids
Use column-visibility controls, legends, Excel export, and drill-down arrows to investigate specific projects or resources.
Common mistake: filters and dates do not recalculate results until you click GO.
Using Project Insights
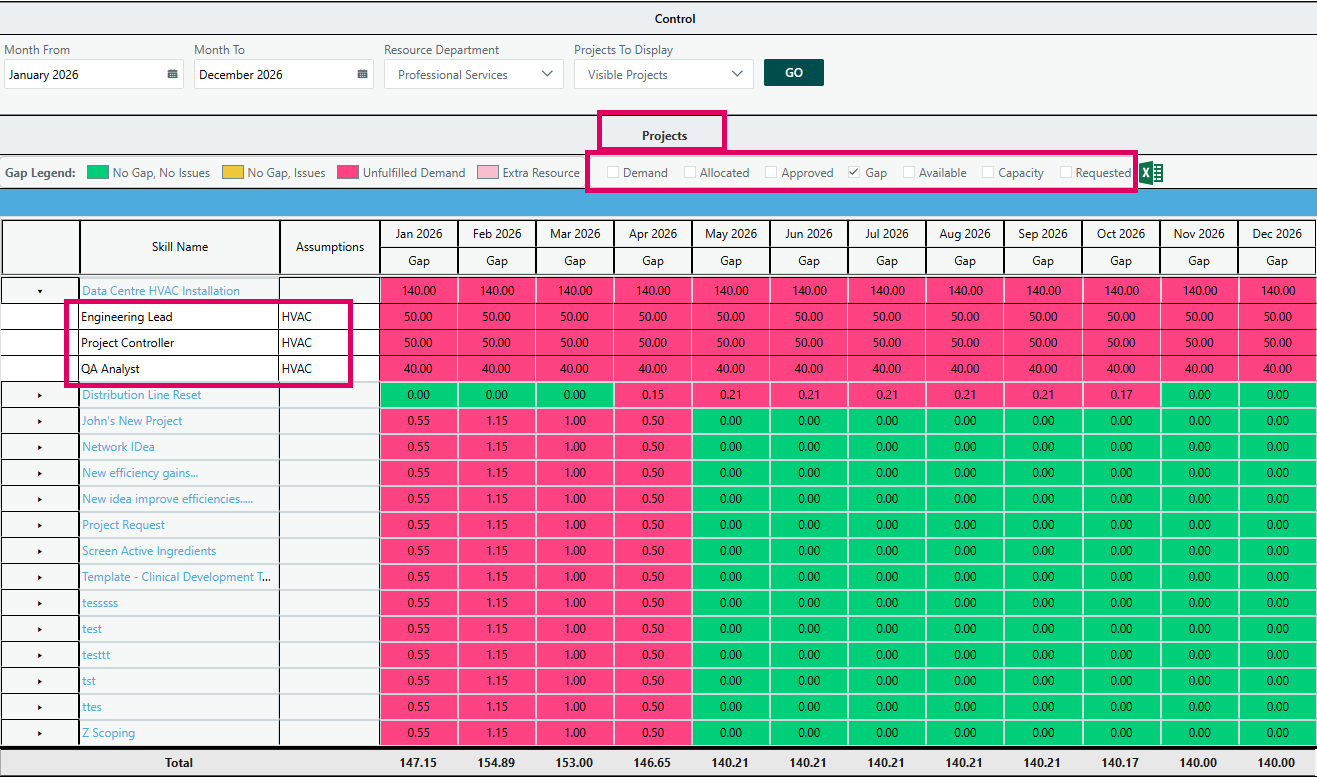
Project Insights is the lightweight option: a filterable project list with no charts and no Resources grid.
- Set the Analysis Window: choose Month From, Month To, then click GO.
- Scope by Resourcing Department or Organization: use whichever control appears in your configuration.
- Choose Which Projects to Display: select Visible Projects, Hidden Projects, or All Projects.
- Apply a Filter: use the hierarchy picker to narrow project scope.
- Read the Projects Grid: use column toggles, gap legends, virtual demand legends, and Excel export.
There is no drill-down and no charting on Project Insights. Use Portfolio Insights when you need either.
Using Resource Insights
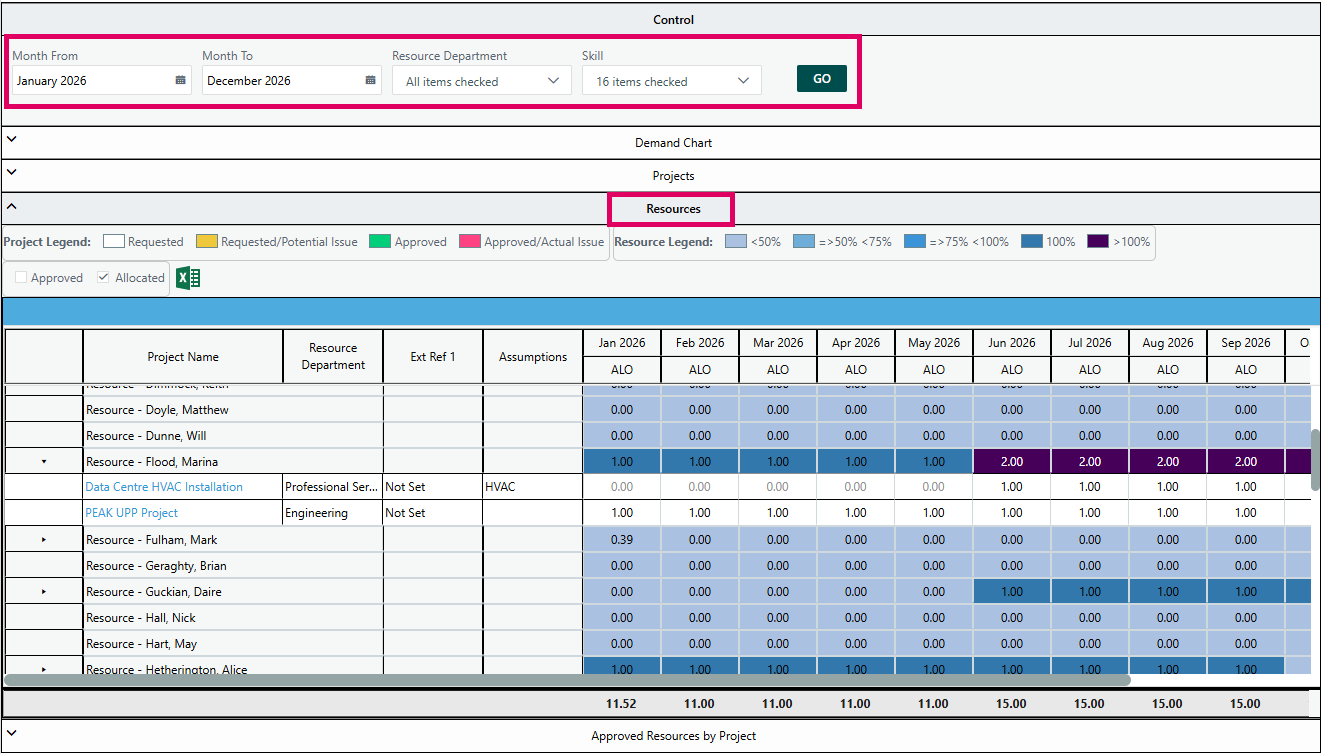
Resource Insights scopes analysis to one or more disciplines and adds discipline-focused charts and manager filtering.
- Set the Analysis Window: choose Month From, Month To, then click GO.
- Scope by Resourcing Department or Organization: use the control shown in your configuration.
- Filter by Discipline: select one or more disciplines, within the configured maximum.
- Filter by Manager: narrow to one or more Prime Resource Managers when available.
- Apply a Filter: use the discipline-level hierarchy picker.
- Read the Demand Chart: compare demand, approved resourcing, and capacity.
- Read the Trend Chart: track Resource Gap Trend (%) over time.
- Read Approved Resources by Project: see which projects drive approved-resource counts.
- Work with the Projects and Resources Grids: use column controls, legends, and Excel export.
Depending on your organization's configuration, the Projects grid and Trend Chart panel may be hidden on Resource Insights.
FAQ
- Which of the Three Insights Screens Should I Use? Use Portfolio Insights to find and drill into gaps; Project Insights for a fast project list; and Resource Insights when focused on disciplines or a manager's team.
- What Is the Difference Between Filter and Advanced Filtering? Filter is a hierarchy picker available on all three screens. Advanced Filtering is a custom-field query builder available only on Portfolio Insights.
- Why Does Project Insights Have No Charts? It is intentionally lightweight. Use Resource Insights or Portfolio Insights when you need charting.
- Why Is There No Resource Utilization Chart on Resource Insights? That chart is unique to Portfolio Insights. Resource Insights instead shows Approved Resources by Project.
- Can I Sort or Page Through These Grids? No. Use filters to narrow results rather than paging or sorting.
- Why Is There No Capacity Line on My Demand Chart? The Capacity line appears only when the filter is broad enough and no specific manager is selected.
- What Do the Gap Legend Colors Mean? They flag No Gap/No Issues, No Gap/Issues, Unfulfilled Demand, and Extra Resource states.
- What Do the Resource Legend Utilization Bands Mean? They bucket each resource by allocation: under 50%, 50–75%, 75–100%, exactly 100%, and over 100%.
Was this article helpful?
That’s Great!
Thank you for your feedback
Sorry! We couldn't be helpful
Thank you for your feedback
Feedback sent
We appreciate your effort and will try to fix the article