The Gantt chart and scheduling system in Cora PPM is the central project management workspace where project managers plan, track, and control all tasks in a project. It is a browser-based, MS Project–compatible scheduling engine that renders an interactive timeline of tasks as horizontal bars, with built-in predecessor logic, critical path analysis, and real-time rescheduling.
What the Gantt Chart Does
The Gantt is the main day-to-day planning surface for a project. Every task is displayed as a row, and each row shows a coloured bar representing its position in time. Users can edit task names, dates, durations, predecessors, percentage complete, phase, priority, resources, skills, risks, issues, costs, WBS codes, and more – all inline, directly in the grid. Changes take effect immediately without requiring a page refresh thanks to an AJAX-based architecture.
Scheduling Engine
Beneath the visual display is a full Critical Path Method (CPM) scheduling engine called the TaskScheduler. When anything changes – a task's duration, a start date, a predecessor link – the engine re-runs automatically:
- Forward pass: computes the Early Start (ES) and Early Finish (EF) of each task by propagating dates through the dependency network.
- Backward pass: computes the Late Start (LS) and Late Finish (LF) by working backwards from the project end, using the same dependency network.
- Total Slack (Float) computation: the difference between LS and ES (or LF and EF), giving each task a "float" value – how many days it can slip before the project is delayed.
- Free Slack: how much a task can slip without delaying any successor's start.
- Critical Path analysis: tasks with zero or negative slack are on the critical path. The engine identifies up to three independent paths (Longest Path, Secondary Path, Tertiary Path) and marks them with colour-coded tiers.
Navigating to the Gantt
- From the top navigation, select your Project from the project selector.
- The main project page will show the Project Banner at the top.
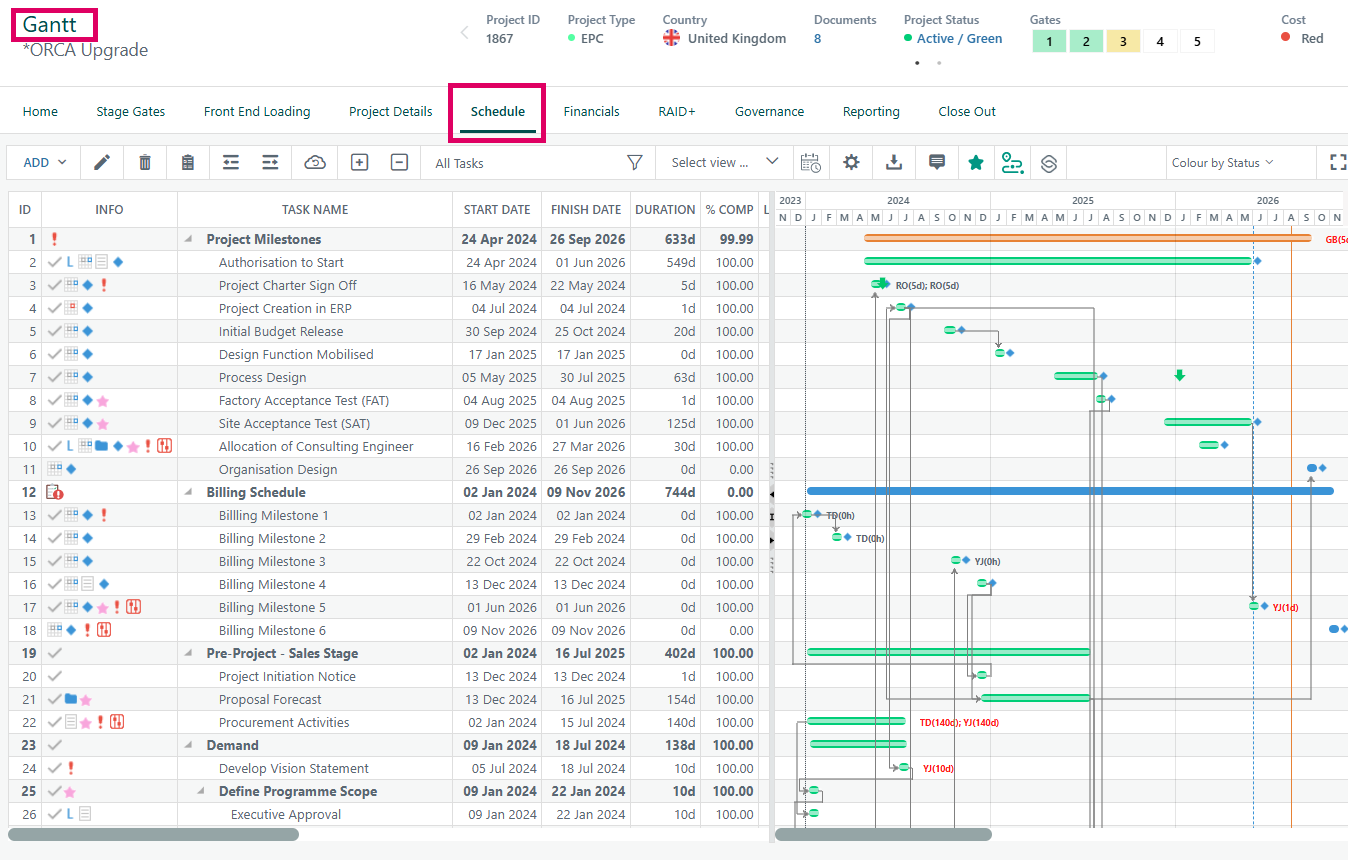
- Click the Gantt link in the project toolbar to open the Gantt Chart page.
Understanding the Layout
- The left panel shows the task grid with columns for: Task Name, Duration, Start Date, Finish Date, % Complete, Predecessors, Successors, Phase, Priority, Status, Resources, Skills, Risks, Issues, WBS Code, Costs, and many more.
- The right panel shows the graphical timeline with coloured task bars. The width of bars represents duration; their position along the timeline represents scheduled dates.
- A vertical today line is drawn in orange at the current date.
- The project banner at the top shows overall project health KPIs.
Adding Tasks
- Inline add: Press Insert on the keyboard, or click the Add Task toolbar button. A new blank row appears immediately. Type the task name and press Tab to move to the next field. The task is saved to the server in the background.
- Multi-add dialog: Click the Add Multiple Tasks button to open a dialog where you can enter many tasks at once, along with start/finish dates, resources, and placement options (after current, as sub-task, before current, at end of project).
- Recurring tasks: Click the Add Recurring Task option to create a parent task with automatically generated child tasks following a daily, weekly, monthly, or yearly pattern. You configure the start date, number of occurrences (or end date), and the duration of each instance.
Editing Tasks
- Inline editing: Click on any cell in the Gantt grid to edit it directly. Press Enter or Tab to save and advance.
- Task detail panel: Click the task row to open its full detail side panel, where all properties (notes, resources, risks, documents, approvals, custom fields) can be edited.
- Drag bars: Drag a task bar in the timeline to move its start date. Drag the right edge to resize (change duration). The scheduler immediately re-computes the schedule and redraws all affected tasks.
Filtering and Finding Tasks
- Use the column header filter boxes to type search terms. Matching tasks are highlighted; non-matching tasks are hidden.
- The All Tasks button clears the current filter.
- Saved Views: Click Save View to store the current combination of column widths, zoom, filter, and baseline selection under a name. Recall it later from the Views dropdown. Views can be marked as Shared for all users of the project.
Sorting
- Click any column header to sort by that column. Click again to reverse the sort. The sort is remembered across sessions for that user and project.
Critical Path
The critical path is shown automatically: tasks on the longest path are highlighted (typically in red/orange based on slack thresholds). Three critical path tiers are identified:
- Longest Path (primary critical path)
- Secondary Path
- Tertiary Path
- Toggle the critical path highlight using the Critical Path button in the toolbar.
Managing Hierarchy (Indent/Outdent)
- Select one or more tasks using checkboxes on the left.
- Click Indent (right-arrow toolbar button) to make the selected tasks children of the task above them. This turns the task above into a summary/mother task.
- Click Outdent (left-arrow toolbar button) to promote the selected tasks one level up.
- The scheduler validates that the new hierarchy would not create a circular dependency before applying the change.
Summary (Mother) Tasks - FD
Groups of child tasks are rolled up under summary tasks (called "mother tasks"). The scheduler handles these by treating each mother task as two virtual nodes – a start and an end – connected to all its children via synthetic Start-to-Start and Finish-to-Finish links. This ensures that the summary bar always spans from the earliest child start to the latest child finish, and that its percentage complete is the duration-weighted average of all its children.
Multi-Project and Inter-Project Dependencies
Projects can link to each other. A task in one project can be a predecessor of a task in another project, so a delay in a predecessor project automatically reschedules downstream tasks in dependent projects. The scheduler handles an entire tree of dependent projects in a single scheduling run.
Out-of-Sequence Detection
When a task is updated in a way that is inconsistent with its predecessor network (e.g. marking a task as started before its predecessor is complete), the system can flag it as "Out of Sequence". Administrators configure whether this is on or off.
Status Date
A Project Status Date acts as a reference anchor for progress reporting. When applied, it can automatically:
- Move unstarted tasks that are scheduled before the status date to a "Start No Earlier Than" constraint on the status date, forcing them to shift forward.
- Propagate the same date change to all sub-projects.
The system supports a configurable cadence for the status date (weekly, monthly, or quarterly).
Baseline Comparison
Users can capture baselines (snapshots of the schedule at a point in time) and view them overlaid on the current schedule. Bars for both the baseline and current dates can be displayed side by side. Native baselines are uncapable, baselines imported from MS Project files cap at 11 (mirroring MSP’s own limit). A traffic-light RAG deviation indicator shows whether each task is ahead of, on, or behind its baseline.
Task Structural Operations
From the Gantt, users can:
- Add tasks – inline (optimistic add that immediately renders a new row), in batch (multi-add dialog), or as recurring tasks (daily, weekly, monthly, yearly patterns with configurable occurrences).
- Delete tasks – with pre-checks for milestones, key activities, and WBS-linked tasks.
- Indent / Outdent – change the hierarchical level of tasks, with circular reference validation before any indent is applied.
- Move and Copy tasks – drag-and-drop or toolbar operations, with predecessor links optionally carried over.
- Copy/Paste entire projects – with fine-grained control over what is copied (resources, risks, notes, documents, predecessors, constraints, etc.).
Filtering, Sorting, and Views
The Gantt supports column-level text filtering, which highlights or hides tasks matching the criteria. Saved views allow users to store their preferred column layout, zoom level, print settings, baseline selection, and filter combination for quick recall. Sorting by any column is persistent across sessions.
Gantt Printing and Export
The Gantt can be printed to PDF or saved as a JPEG image using wkhtmltopdf/wkhtmltoimage. The print logic automatically selects the appropriate time scale (week, month, year-by-month, year-by-quarter, decade) based on the project length, and generates multi-page output. A separate WBS (Work Breakdown Structure) network diagram view can also be printed.
Schedule Risk Analysis (Monte Carlo)
A Schedule Risk Analysis module runs thousands of Monte Carlo simulations on the project network (up to 10,000 iterations, default is 1000). Each simulation randomises task durations within optimistic/pessimistic bounds, runs the full CPM forward pass, and records the project finish date. The resulting distribution gives probability percentiles (e.g. "80% confidence the project finishes by...") for schedule risk management.
Calendar Awareness
The scheduling engine is fully calendar-aware. Company-wide holidays, per-project excluded working days (e.g. weekends), and per-task custom calendars are all respected in every duration calculation. Task-level calendars override project-level calendars for individual tasks.
Creating Dependencies (Links)
- Graphically: Hover over a task bar. Connector handles appear at the left and right ends. Drag from one task's right handle to another task's left handle to create a Finish-to-Start link. Connecting left-to-left creates a Start-to-Start link.
- Via the Predecessors column: Type the row number(s) of predecessor tasks in the "Predecessors" column. Include the link type and lag using MS Project notation: e.g.,
3FS+2(task 3, finish-to-start, 2-day lag),5SS-1(start-to-start, 1-day lead). - Editing a link: Click on the connector line between two tasks to open a link editor where you can change the type, lag, and lag justification.
Dependency (Link) Types
Four MS Project–style link types are supported between tasks:
- Finish-to-Start (FS): the successor cannot start until the predecessor finishes (the most common type).
- Start-to-Start (SS): both tasks start at the same time.
- Finish-to-Finish (FF): both tasks finish together.
- Start-to-Finish (SF): the least common; successor finishes when predecessor starts.
All link types support a lag value (positive = delay, negative = overlap/lead). Lags can also be marked as elapsed (working through weekends/holidays using raw calendar time).
Using Constraints
- Right-click a task or open the task detail panel.
- Under Constraint, choose the constraint type (ASAP is default) and, where applicable, the constraint date.
- Constraints such as Must Finish On (MFO) pin a task to a specific date; the scheduler will flag negative slack if predecessors push the task past that date.
Task Constraints
Each task can have one of ten constraint types controlling how the scheduler treats it:
- ASAP (As Soon As Possible) – the default; starts as early as the predecessor network allows.
- ALAP (As Late As Possible) – pushed as late as possible within the network.
- SNET / SNLT – Start No Earlier Than / Start Not Later Than a specified date.
- FNET / FNLT – Finish No Earlier Than / Finish Not Later Than a specified date.
- MSO / MFO – Must Start On / Must Finish On a fixed date (like a hard pin).
- SO / FO – Start On / Finish On (used internally and by import).
ALAP tasks receive special treatment: the scheduler runs a second forward pass after the backward pass has determined their Late Start, then places them at that late date.
Colours and Slack Legends
Task bars are colour-coded by their total slack value:
- Red – slack at or below the project's "red" threshold (highest urgency).
- Orange – between the red and blue thresholds.
- Blue – between the blue and maroon thresholds.
- Green – above the maroon threshold (most comfortable float).
- Grey – summary/mother tasks.
- Dark blue – linked sub-projects.
These thresholds are configurable per project.
Setting the Status Date
- In the Gantt toolbar, find the Status Date control.
- Click it and enter the new status date (or clear it to remove it).
- A confirmation dialog asks whether to move unstarted tasks that fall before the status date to a "Start No Earlier Than" constraint on the status date.
- Optionally, check Propagate to Sub-Projects to apply the same change to all child projects.
Viewing Baselines
- In the Gantt settings/view toolbar, open the Baseline dropdown.
- Select a baseline snapshot. A thin bar (typically in a contrasting colour) is overlaid on each task bar showing its baseline position.
- A second baseline can be selected for comparison.
- Red/amber/green RAG indicators next to each task show deviation from baseline.
Printing
- Click the Print button in the Gantt toolbar.
- Choose print options: paper size (A4, A3, Letter), orientation (portrait/landscape), what to include (task name, start/finish dates, resources, % complete, slack legend, ID column), and which tasks to print (all, HLDs only, critical path only, by status filter).
- The system automatically selects the best time scale to fit the project's date range.
- Output is available as PDF or JPEG.
Working with Sub-Projects
- In the Gantt, tasks that are linked to sub-projects are shown with a dark blue project bar.
- Click the expand arrow on a linked-project row to expand it and show the sub-project's tasks inline.
- Use the Programme View button to automatically expand all sub-projects in the hierarchy.
Gantt Timeline View
The Gantt timeline in Cora PPM is the right-hand graphical portion of the project schedule screen. It is a fully interactive, scrollable chart that sits beside the task list and renders every task, milestone, dependency, and schedule-related indicator as visual objects aligned to a shared date scale. The key capabilities packed into that chart area are as follows.
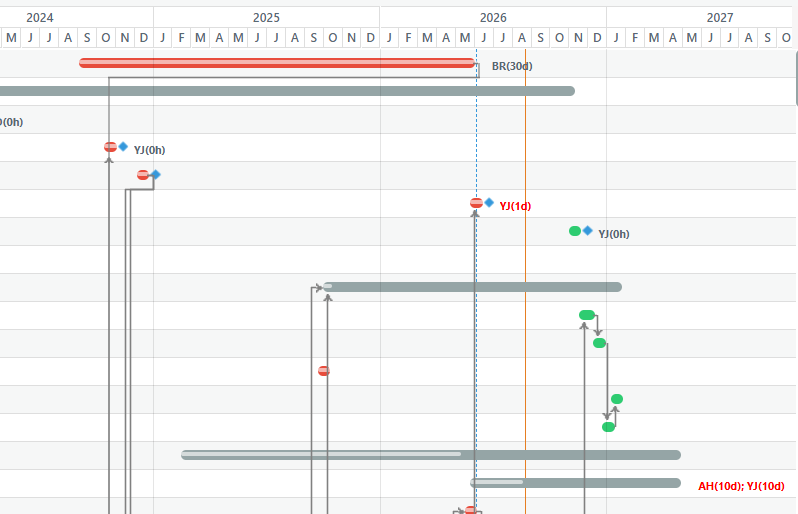
Date header and zoom. The timeline header always shows two rows: an upper row of larger time bands (years, months, or weeks depending on zoom) and a lower row of finer increments (months, weeks, or days). Users choose from six zoom levels — Days, Weeks, Months, Quarters, Half-Years, and Years — which scales every bar and marker proportionally. The system calculates the start and finish of the visible range automatically from the earliest task start date to three or more years beyond the latest task finish, padded to clean calendar boundaries. Month names and day-name abbreviations are localised at render time; holidays and excluded weekdays are highlighted in a contrasting colour in Day zoom level.
Task bars. Every task row displays a coloured horizontal bar whose left edge represents its scheduled start date and whose right edge represents its finish date. Bar width is calculated in pixels from a scaleFactor that maps one day to a fixed pixel count at each zoom level. The bar colour reflects either the task's own custom colour or, when the "Colour by Status" mode is active, the configured colour of the task's current status (e.g. Not Started, Started, On Hold, Complete). Switching to "Colour by Slack" replaces the fill colour with one of four traffic-light colours based on how much float the task has relative to three administrator-configured thresholds (red, amber, blue, green).
Milestone markers. Any task flagged as a milestone (zero duration, or explicitly typed as a milestone task type) is rendered as a diamond-shaped marker rather than a bar. The task tooltip identifies it as a milestone, and a small milestone icon is shown in the task's info column. A separate marker appears for milestones that have zero duration but are not formally typed as milestones (labelled "without a deliverable").
Progress bar overlay. When the "Show Progress" option is enabled, a secondary narrower bar is drawn on top of each task bar extending from the task start date to the date implied by its percentage complete. This gives an at-a-glance view of whether work is tracking ahead of or behind the planned position.
Today line. A vertical dashed line is drawn at today's date — this is the blue dashed line visible in the screenshot. It extends the full height of the chart area and is labelled "Today: [formatted date]" in the toolbar. Users can show or hide it via the Zoom/Options dialog's "Show Today" checkbox.
Live date line. A second vertical line represents the project's live date (the agreed delivery target). This is separate from today and gives a clear marker of the contractual or planned completion point.
Status date marker. A third vertical marker (styled differently — .gantt-psDate CSS class) shows the project's current status date. This is the date up to which actual progress has been recorded. When a status date is set, it appears on the chart and the tooltip shows the formatted date. The marker is only drawn if the status date falls within the visible gantt range.
Freeze period shading. When the Freeze Periods feature is enabled and the project has a status date and a configured freeze period offset, a shaded region is drawn on the chart spanning from the start of the current fiscal period to the end of the freeze window. Tasks whose dates fall within this period cannot normally be moved.
Baseline bars. The timeline can show up to two baselines simultaneously. Each baseline is drawn as a secondary bar in a distinct style, offset slightly below the main bar for visual separation. The tooltip for each task shows baseline start, baseline finish, baseline duration, and the deviation ("now X days later/earlier/on target"). Both internally-created baselines and baselines imported from MSP files are supported. An administrator-controlled RAG override lets projects set their own deviation thresholds for when baseline deviations turn amber or red.
Dependency (link) lines. Horizontal and vertical connector lines are drawn between predecessor and successor tasks. Four dependency types are supported: Finish-to-Start (FS), Start-to-Start (SS), Finish-to-Finish (FF), and Start-to-Finish (SF). A lag value (positive or negative, in days, optionally elapsed) can be set on each link. Inter-project (cross-project) links are drawn as a distinct line style. Clicking a link line opens a popup to view and edit the lag, type, and whether the link is "enforced."
Drag-to-resize and drag-to-move bars. Users with full project access can drag the left edge of a bar to change its start date, the right edge to change its finish date, and the middle of the bar to move it entirely (keeping duration). The cursor changes appropriately (west-resize, east-resize, move) as the mouse position tracks across different zones of the bar. Non-editable tasks (locked by task type configuration or access rights) use a plain cursor and ignore drags.
Driving path highlighting. When "Driving Path" is enabled (default), selecting a task highlights the chain of predecessor tasks that drive its dates in a gold/amber colour, while all other task bars are dimmed to grey. This visually shows the network path that controls the selected task's schedule.
Critical path colouring. Tasks on the critical path carry a taskCriticalPath flag (values '0', '1', '2', '3' for longest path, secondary, tertiary). The filter panel exposes filter buttons for "Longest Path," "Secondary Path," and "Tertiary Path" that hide all tasks not on the selected path. The colouring logic is client-side — the RefreshCriticalPathTasks function maps the server-returned dictionary into the parallel array; the DrawBar function reads this to select the appropriate bar colour.
Bar interaction and tooltips. Hovering over any bar pops up a rich tooltip showing: task name, start/finish dates, duration (with elapsed suffix if applicable), % complete, status, phase, task type, calendar, planned resources (up to 5 names), actual effort and resources, baseline deviation if a baseline is selected, constraint type and date, documents, notes indicator, KPIs, driving task, and materials. Hovering a link line shows its type, lag, lag justification, and the names of the two connected tasks.
Inline task editing directly from the chart. Double-clicking a task bar opens the inline edit form overlaid on the task row (same as double-clicking on the left-side task list). Dragging a bar end also triggers the date-recalculation AJAX call (Gantt.aspx/ChangeDates) to auto-derive the third value from any two of start, finish, and duration.
Project and programme view. Linked sub-projects can be "expanded" inline — their tasks appear nested beneath the parent task row in the same chart. Users can view a full programme hierarchy (all sub-projects recursively) by clicking "View Programme" or "View All." Expanding projects triggers a server postback that loads the sub-project tasks and draws their bars in the same timeline using the same date scale.
Scroll synchronisation. Scrolling the task list vertically also scrolls the chart. Scrolling the chart horizontally moves the date-header area in sync. A "Locate in Gantt" menu item (Ctrl+Alt+N) scrolls the chart horizontally to bring the selected task's bar into view.
Export and print. The timeline can be exported as PDF or image via the Export button. The print path uses a dedicated GanttWbsExportFrame iframe that renders the chart and invokes a PDF or image generator on load. Column selection for print is configurable per-user via saved print settings.
Schedule restore points. Users can create, select, and delete named "restore points" — snapshots of the entire project XML exported to MSP format — from the toolbar. Restoring a point re-imports the schedule and refreshes the timeline.
User settings persistence. All timeline settings (zoom level, baseline selections, "show today/progress/summary tasks," left-pane width, expanded/collapsed state, column order, column widths, active filter) are persisted per-user per-project via AJAX calls to Gantt.aspx/SaveOptions and are re-applied on the next page load.
Finding the Timeline
Open a project and navigate to the Gantt view. The screen is split vertically: the left pane shows the task list columns; the right pane is the timeline chart. A draggable splitter divides the two.
Changing the Zoom Level
- Click the zoom icon (magnifying glass) in the toolbar, or right-click on the date header.
- The Zoom/Options pop-up opens. Select a zoom: Days, Weeks, Months (default), Quarters, Half Years, or Years.
- Click OK. The timeline recalculates date headings and redraws all bars.
- Tip: Smaller zoom levels (Days) show company holidays and excluded weekdays highlighted in colour. Larger zoom levels (Years, Quarters) are useful for programme-level views.
Reading the Date Headers
- Top row: Large time bands (years or months).
- Bottom row: Finer increments (months, weeks, or days).
- Clicking or right-clicking on the header area opens the zoom menu.
Navigating the Timeline
- Horizontal scroll: Scroll the chart area left/right to move through time.
- Vertical scroll: Scroll the task list; the chart scrolls with it.
- Locate task: Select a task in the list and press Ctrl+Alt+N (or use the right-click menu → "Locate in Gantt") to scroll the chart to the selected task's bar.
- Today line: A vertical dashed blue line marks today's date. Enable/disable in Zoom → "Show Today."
Working with Baselines
- Click the zoom icon → scroll down to the Baseline dropdown.
- Select a baseline (system, imported, or user-named). It appears as a thin secondary bar behind each task's main bar.
- A second baseline can also be selected from the Baseline 2 dropdown.
- Hover any task bar to see the tooltip showing baseline dates and deviation text ("now X days later/earlier/on target").
- Note: Baselines are created from the toolbar → Restore Point → Create (which exports to MSP format). To create a "classic" baseline, project managers use the project's Baseline section.
Understanding Bar Colours
- Default: Each task bar colour is set on the task (or defaults to the project colour).
- Colour by Status: Shows bars in the status-type colour (configured by admin — e.g. red for Not Started, green for Complete).
Colour by Slack: Shows bars in traffic-light colours based on float:
- Red: Lowest slack threshold (most at risk)
- Amber: Medium slack
- Blue: Moderate slack
- Green: Most slack (least at risk)
- Toggle between modes using the "Colour by Status / Colour by Slack" toggle in the right side of the toolbar. The colour legend is shown in the toolbar.
Using the Status Date
- Click the Status Date icon in the toolbar (calendar icon).
- Enter or select a date, then click Save.
- A vertical marker appears in the chart at that date.
- Tasks that are scheduled to start or finish before the status date but have not yet recorded actual dates are flagged with a "late task" icon.
Milestone Markers
- A milestone is shown as a diamond symbol on the bar rather than a filled rectangle.
- Milestones with a deliverable have a standard milestone icon in the info column.
- Milestones without a deliverable ("zero duration, non-typed") are shown with the same diamond but a different tooltip.
Dependency Lines
- Predecessor/successor lines are drawn as L-shaped connectors between bars.
- Hover a connector line to see a tooltip showing: link type, lag, and connected task names.
- Double-click a connector to open the link edit dialog, where you can change type (FS/SS/FF/SF), lag, elapsed flag, and whether it is enforced.
- To draw a new link: right-click a task → "Add Link From", then right-click the target task → "Add Link To."
Driving Path
- Enable with the Driving Path button (chain icon) in the toolbar.
- Select a task: its driving predecessor chain is highlighted in gold/amber; all other tasks are dimmed.
- Disable by clicking the button again.
Critical Path Filtering
- Click the Filter button → Critical Path section.
- Choose Longest Path, Secondary Path, or Tertiary Path.
- The timeline shows only those tasks; all others are hidden.
- Click All Tasks in the filter to restore the full view.
Dragging Bars to Change Dates
- Move bar: Drag the centre of a bar to slide the task's start and finish dates together.
- Extend finish: Drag the right edge to change the finish date (duration adjusts).
- Extend start: Drag the left edge to change the start date (duration adjusts).
- A tooltip shows the new proposed dates as you drag.
- Only tasks with full edit access respond to drag; summary/linked project bars are locked.
Restore Points (Schedule Snapshots)
- Click the Restore Point icon in the toolbar.
- Create: Enter a name and click Save. An MSP export is stored.
- Select (Restore): Choose a saved restore point from the dropdown to re-import that schedule.
- Delete: Remove obsolete restore points from the same menu.
Expanding Sub-Projects into the Timeline
- A project task with a linked sub-project has a project icon in its info column.
- Click the expand arrow on that task row to load the sub-project tasks inline in the same chart.
- Use View Programme (toolbar expand menu) to load all sub-projects at once.
Common Pitfalls
- No bar visible: The task has no start or finish date. Assign dates or use auto-scheduling.
- Baseline comparison not showing: The project has no baselines yet, or the baseline you selected has been deleted. Take a baseline first.
- Drag has no effect: You may lack "Full Access" rights to that project, or the task type is configured as non-editable.
- Today line missing: Turn on "Show Today" in the Zoom/Options dialog.
- Bars clipped at the timeline edge: The scale auto-extends 3+ years beyond the latest task; if a task has a far-future date (e.g. a data entry error), the chart will be very wide.
Was this article helpful?
That’s Great!
Thank you for your feedback
Sorry! We couldn't be helpful
Thank you for your feedback
Feedback sent
We appreciate your effort and will try to fix the article