Geographic Maps
Cora PPM — End-User Enablement Guide
What is It?
Where it lives: Project → Home → Utilities → View on Map (your organisation may have relabelled this tab). No access? You’ll see a read-only notice instead of the drawing tools.
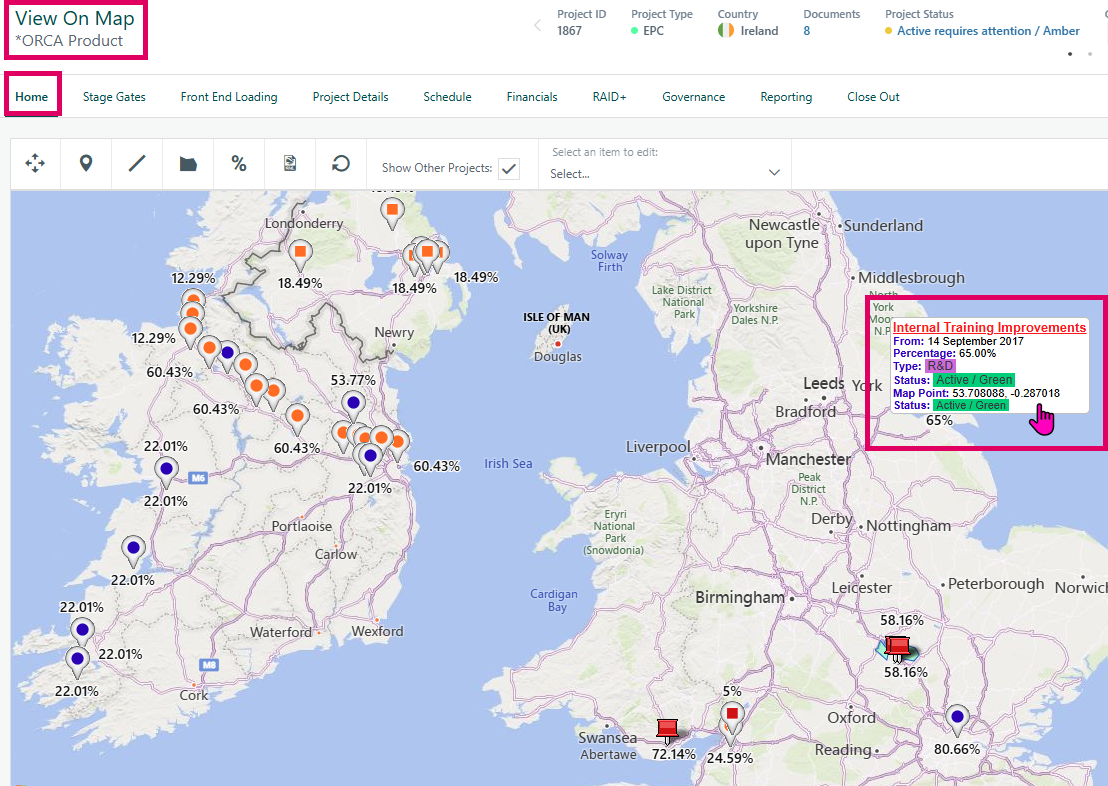
Geographic Maps is the mapping module built into Cora PPM. It plots your project data — sites, delivery locations, drawn boundaries, routes — onto an interactive map, right alongside the rest of the project record.
- Open any project and click its Map tab to view and edit that project’s own map data: pins, lines, and shapes tied specifically to that piece of work.
- From a portfolio or project list, open a Report Map to plot a whole selection of projects together on one read-only map for a bird’s-eye view across the portfolio.
- The module runs on Bing Maps by default; administrators can configure Google Maps or an Esri-based GIS integration instead. Day-to-day tools stay the same.
Why Teams Use It
Benefit | What It Means |
|---|---|
See the portfolio in space, not just in rows | Every site, plant, or delivery point becomes a mark on a map instead of a line in a table — geographic spread is obvious at a glance. |
Capture the real footprint, not just a point | Draw the actual site boundary, corridor, or route with the line and polygon tools — useful wherever “the project” is an area, not an address. |
Spot what else is nearby | Toggle Show Other Projects to overlay markers from the rest of the portfolio — handy for shared site visits, logistics, or spotting overlap. |
Take the data with you | Export what you’ve mapped to KML and open it in Google Earth or another GIS tool for reporting, review, or handover. |
Matches how your org already draws maps | Icons, line colours, fill colours, units, and the default starting view are all set centrally, so every project’s map looks and behaves the same way. |
Controlled, not open season | Viewing and editing are separate permissions, so read-only stakeholders can look without risk of moving anyone’s pin. |
Common Use Cases by Project Type
The map works the same way for every project, but what teams choose to plot on it differs by the kind of work.
Project Type | Typical Map Uses |
|---|---|
? Manufacture-to-Order (MTO) |
|
? Pharma |
|
?️ Capital Projects |
|
?️ GovCon |
|
Key Terms
Term | Definition |
|---|---|
PPM | Project Portfolio Management — the overall Cora product; this guide covers one module inside it. |
GIS | Geographic Information System — software that captures, stores, and displays location-based data. |
KML | Keyhole Markup Language — an XML file format for geographic data, readable by Google Earth and most GIS tools. This is what the Export button produces. |
GPS | Global Positioning System — the coordinate system behind every pin, line, and shape you place. |
Esri | A major GIS software vendor and one of the mapping providers administrators can connect to the module. |
MTO | Manufacture-to-Order — production that starts only once a customer places an order. |
GovCon | Government Contracting — delivering work under a government contract, typically with formal program and compliance reporting. |
Polyline | A drawn line made of one or more straight segments, used for routes, corridors, or pipelines. |
Step-by-Step Guide
Toolbar Reference
Icon / Control | What It Does |
|---|---|
Pan | Drag the map to move around without editing anything. |
Create Marker | Drop a pin at a location. |
Create Line | Draw a route or corridor made of connected points. |
Create Polygon | Draw a closed, filled shape for a site boundary or zone. |
Show/Hide Info | Toggle an info overlay on the map. |
Export KML | Download the project’s map data as a KML file. |
Refresh | Reload the map. |
Search | Jump the map to an address or place name. |
Show Other Projects | Checkbox to overlay markers from the rest of the portfolio. |
Select an Item to Edit | Dropdown listing existing shapes on this project’s map. |
1. Open the Map for a Project
- Open the project you want to map.
- Click the Map tab on the project record.
- The screen loads centred on wherever the project’s map was last left — or your organisation’s default starting view if nothing has been added yet.
2. Drop a Pin for a Site
- Click Create Marker in the toolbar.
- Click the map at the location — or type an address or place name into Search first and jump straight there.
- In the tooltip editor, fill in a Header and Details, then click Save Tooltip.
- Want a different pin style? Select the marker, click Change Icon, and choose from your organisation’s configured icon set.
3. Draw a Route or Corridor
- Click Create Line.
- Click each point along the route in order.
- Press
Escwhen the line is finished to leave drawing mode.
Shortcut | Action |
|---|---|
| Add a point |
| Remove a point |
| Split the line there |
4. Draw a Site Boundary or Zone
- Click Create Polygon.
- Click each corner of the area in order — the shape closes and fills automatically as you go.
- Press
Escwhen the shape is complete.
Line and fill colours come from your organisation’s settings, so every project’s boundaries look consistent.
5. Edit, Convert, Join, or Delete a Shape
- Choose the shape from the Select an item to edit dropdown, or click it directly on the map.
- Drag its points to reshape it, using the same Ctrl / Shift / Alt click rules as drawing.
- Use Convert to turn a line into a polygon (or back), Join to merge it with another selected line, or Delete to remove it.
6. Check the Icon Key and Other Projects
- Click Show Icon Key to see what each icon on the map means.
- Toggle Show Other Projects to overlay markers from the rest of the portfolio, or hide them to focus on this project alone.
Your Show Other Projects preference is remembered for next time you open a map.
7. Save and Export
- Click Save to persist your changes. This button only appears if you hold rights to update the project map — otherwise the screen is view-only.
- Click the Export KML icon at any time to download the project’s map data for Google Earth or another GIS tool.
8. View Several Projects Together
- From a project list or search results, select the projects you want to see side by side.
- Open the Report Map view for that selection.
- All selected projects plot on one map, read-only — useful for a portfolio or steering-committee review.
The exact menu path to the Report Map depends on how your organisation has set up reporting — ask your PPM administrator if you can’t find it.
For administrators: the default centre point and zoom, line/polygon colours and widths, distance units, and the custom Map Icons list are all managed under Admin → Bing Configuration, across its three tabs: Bing Configuration, Lines and Colours, and Map Icons. If a user needs a new icon or a colour change, that’s the screen to visit.
FAQ
Question | Answer |
|---|---|
Which map provider does Cora PPM use? | By default, Bing Maps. Your administrator can configure Google Maps or an Esri-based GIS integration instead — the tools you use on screen stay the same either way. |
I Don’t See a Save Button — Why Can’t I Edit the Map? | Editing requires the “update project map” right. Without it, the screen opens in view-only mode with a notice instead of the drawing tools. Ask your PPM administrator to grant the right if you need to edit. |
Can I see other projects’ pins on my project’s map? | Yes — toggle Show Other Projects in the toolbar. Your choice is saved per user, so it’s remembered the next time you open a map. |
What’s the difference between a marker, a line, and a polygon? | A marker is a single pinned point, a line is one or more connected segments, and a polygon is a closed, filled shape. Pick whichever matches what you’re representing. |
How do I change what a pin looks like? | Select the marker, click Change Icon, and choose from the icon set your administrator has configured under Admin → Bing Configuration → Map Icons. |
How do I edit or reset the popup text on a pin? | Select the marker, click Change Tooltip, edit the Header and Details fields, then Save Tooltip. Click Clear Tooltip instead to revert it to the default. |
Can I get the map data out of Cora PPM? | Yes — click the KML export icon in the toolbar to download the project’s pins, lines, and shapes as a KML file, which opens in Google Earth or most other GIS tools. |
Can I see many projects on one map at once? | Yes, using the Report Map view: select a set of projects from a list or search, then open the report map for that selection. It plots all of them together, read-only. |
I Made a Mistake Drawing a Line or Polygon — How do I Fix It? | Select it from the Select an item to edit dropdown, then Ctrl-click to add a point, Shift-click to remove one, or Alt-click to split a line. Or select it and click Delete to remove it and start again. |
Does the map colour-code pins by project status automatically? | No — icons are chosen manually per marker, or default to whatever icon your administrator has set for that project. There’s no automatic status-based colour coding on this screen. |
Cora PPM · Geographic Maps Enablement Guide
Was this article helpful?
That’s Great!
Thank you for your feedback
Sorry! We couldn't be helpful
Thank you for your feedback
Feedback sent
We appreciate your effort and will try to fix the article