My Dashboard is a personalised, widget-based home screen in Cora PPM that gives each user a configurable view of their own portfolio data. Unlike the Executive or Project dashboards (which show organisation-wide or single-project data), My Dashboard is scoped to the currently logged-in user — surfacing things like their tasks, risks, issues, approvals, workflow items, and resource allocations across all projects they have access to.
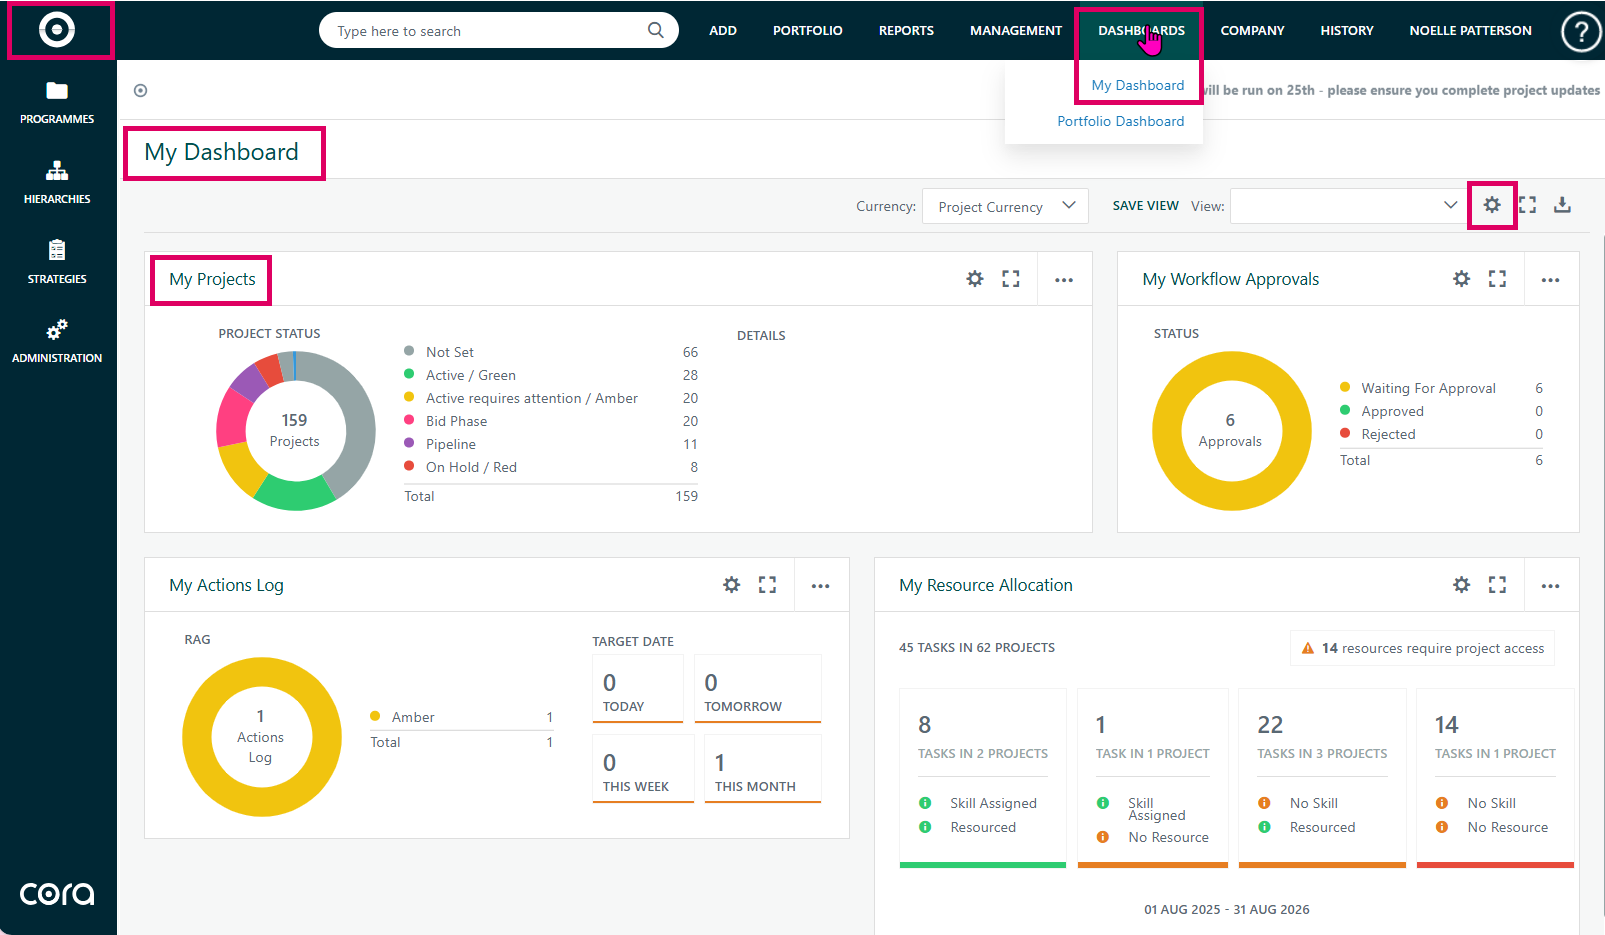
My Dashboard is a personalised, widget-based home screen in Cora PPM that gives each user a configurable view of their own portfolio data. Unlike the Executive or Project dashboards (which show organisation-wide or single-project data), My Dashboard is scoped to the currently logged-in user — surfacing things like their tasks, risks, issues, approvals, workflow items, and resource allocations across all projects they have access to.
The dashboard is built on a drag-and-drop grid system. Each piece of content (a list of tasks, a risk summary, a chart, etc.) lives in its own widget, displayed inside an iframe. Users can choose which widgets appear, how many instances of each to show, where they are positioned on the grid, and what date ranges they apply to. These preferences are saved per-user and persist between sessions.
Key capabilities include:
- Widget selection and layout — users pick which widgets to display via a "Manage Widgets" dialog, then drag and resize them on a grid.
- Saved Views — users can save named snapshots of their widget layout and switch between them. Views can be shared with other users, and the system warns if a shared view has been updated since you last loaded it.
- Multi-currency support — if enabled by administrators, a currency dropdown lets users see financial data in their preferred currency.
- Export — the entire dashboard or individual widgets can be exported as an image (PNG) or to Excel.
- Expand/collapse — the dashboard can be expanded to full-screen mode.
- Pendo integration — an optional icon area is shown if a Pendo company name is configured.
- Resource-Only users — users flagged as "Resource Only" see a restricted set of widgets (My Issues, My Tasks, My Risks, and optionally My Workflow Approvals), this is the only area of Cora PPM a Resource Only user can see.
- Feature-flag-controlled widgets — many widgets only appear if the corresponding feature is licensed and switched on (e.g., Financial Management, Risks & Issues, EVM, Opportunities, Chart Widget, Bubble Chart, Resource Allocation, etc.).
Accessing My Dashboard
- Navigate to My Dashboard from the main menu (Top Navigation Bar) or click on the Cora Icon in the top left-hand side .

Understanding the Layout
- The page displays a header with the title "My Dashboard".
To the right of the title you will see (depending on configuration):
- A currency dropdown (if Multi-Currency is enabled and you are associated with a project).
- A Views dropdown and Save View button (for switching between saved layouts).
- Three icon buttons: Settings (gear/cog), Expand (full-screen toggle), and Export (download).
- A Pendo icon area (if Pendo is configured by your administrator).
Managing Widgets

- Click the Settings (cog) icon in the top-right of the dashboard header.
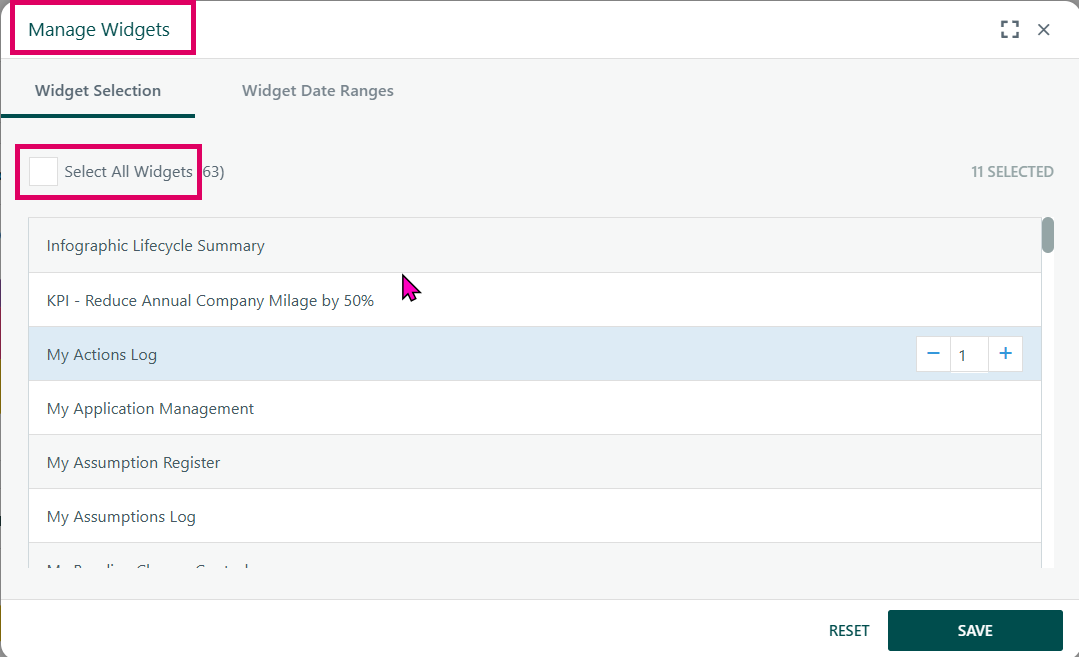
- The Manage Widgets dialog opens (
MyDashboardManageWidgets.aspx). - Widget Selection tab: A list of all available widgets appears. Click a widget to toggle it on or off. A counter shows how many instances are enabled. You can add up to the system maximum (typically 10, configurable by admins).
- Widget Date Ranges tab: Set a default date range that applies to widgets which support date filtering. You can choose a predefined range (e.g., "Last 6 months") or specify custom From/To dates.
- Click Save to apply your changes. Click Reset to restore defaults. A warning appears if you are about to remove widgets that are already on your dashboard.
Rearranging Widgets
- Drag any widget by its header bar to reposition it on the grid.
- Resize widgets by dragging their edges/corners.
- Layout changes are saved automatically (after a 1-second debounce).
Working with Widgets
Each widget has its own header bar containing:
- Title — the widget name (may be customised).
- Date range indicator — shown if the widget has a custom date range different from the dashboard default. Click the X to reset it to the dashboard default.
- Settings icon — opens that widget's individual settings.
- Expand icon — expands the widget to full size (collapses other widgets temporarily).
- Menu (three dots) — offers Export (image or Excel) and Remove options.
Saved Views

- Click Save View to save your current widget layout as a named view.
- Give the view a name and choose whether to share it with other users.
- Use the Views dropdown to switch between your saved views (including shared views others have made available).
- Click the dropdown arrow to also access Manage Views (to delete or deselect views) and Reset View (to reload the current view from the server).
- Stale shared view warning: If a shared view you are using has been updated by its owner since you last loaded it, a confirmation prompt will appear asking if you want to reload it (losing any local changes) or save your current state as a new view.
Currency Selection

- If your administrator has enabled Multi-Currency, a dropdown at the top of the dashboard lets you switch the currency used for financial widgets.
- Your selection is saved per-user and persists across sessions.
Exporting

- Export individual widget: Use the widget's menu → Export. Choose Image or Excel format.
- Export whole dashboard: Click the Export icon in the dashboard header. All widgets are loaded first (including any not yet scrolled into view), then you choose the format.
Expanding the Dashboard

- Click the Expand icon (top-right header) to hide the page header and navigation, giving widgets more screen space.
- Click again (now a collapse icon) to restore the normal view.
Tips and Gotchas
- If you are a resource-only user, only a restricted set of widgets will be available to you: My Issues, My Tasks, My Risks, and (for some customers) My Workflow Approvals.
- Some widgets are only available if specific features are licensed and enabled (e.g., Financial Management, Risks & Issues, EVM, Opportunities). If you do not see an expected widget, check with your administrator.
- The maximum number of widget instances is controlled by an admin setting (default: 10 total, max 2 instances of any single widget type).
- Widgets load progressively as you scroll down — not all widgets load immediately on page open.
- If you leave the page while in full-screen/expanded mode, the dashboard automatically collapses back to normal.
Widgets
Administrators control which widgets are available to users and which appear by default; users then personalise the layout themselves.
The widgets fall into several natural groups:
- Personal work-item trackers — showing items where the current user is directly involved (e.g. their own tasks, risks, issues, opportunities, approvals).
- Approval queues — surfacing items waiting for the user to approve or act upon (timesheets, tasks, project time, workflow steps, demand, forecast).
- Project visibility — listing projects the user has access to, or a subset they "own".
- Financial / forecasting queues — dedicated panels for forecast review queues (WIP, EAC, standard).
- Charting and visualisation — configurable chart widgets, KPI quad status, and Infographic widgets.
- Custom Register ("My Register") widgets — dynamically generated, one per enabled Custom Register, showing records belonging to the current user.
Certain widgets only appear when the relevant system feature is enabled (e.g. Financial Management, Workflow, Task Approvals, Risks & Issues, Opportunities, Timesheets, Resource Allocation, Project Requests). Some are gated by feature toggles (Projects By Attribute, Waterfall, Bubble Chart, Chart Widget, Smart Form Fields, Resource Allocation, Inactive Users). Resource-only users see a restricted subset (My Issues, My Tasks, My Risks, and their Custom Register widgets only).
Was this article helpful?
That’s Great!
Thank you for your feedback
Sorry! We couldn't be helpful
Thank you for your feedback
Feedback sent
We appreciate your effort and will try to fix the article