A Risk Widget in Cora PPM
A Risk Widget in Cora PPM is a dashboard panel that gives users a visual summary and detailed list of project risks. There are two distinct variants:
Widget Type | Description | Where It Appears |
|---|---|---|
? Risks Widget | Shows risks across one or more projects, including sub-projects, program-level and Portfolio risks, subject to the user's access rights. | Project Dashboards, Executive Dashboards, and Strategy Dashboards |
? My Risks Widget | Shows only risks where the currently logged-in user is the owner, pulled across all projects the user has access to. | Personal My Dashboard |
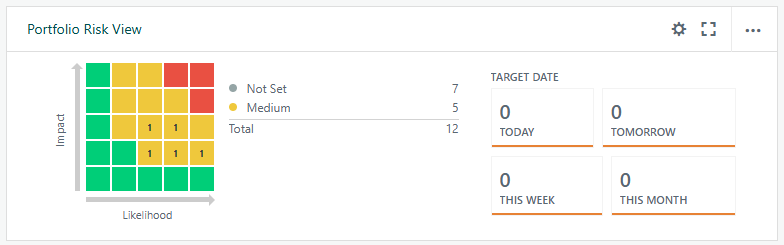
Shared Visual Structure
- Summary Panel: A color-coded risk matrix (probability vs. impact grid) showing how many risks, or their cost/time/quality impact, sit at each probability/impact intersection. Alongside the matrix is a date counters panel showing how many risks are due today, tomorrow, this week, this month, or are overdue.
- Detail Grid: A full data grid listing individual risks with columns such as description, status, risk level, probability, impact, cost impact, time impact, target date, owner, raised by, related task, residual risk, documents, and more. Users can click rows to open a risk for editing, close or reopen risks, transfer a risk to an issue, delete risks (if permitted), or export to Excel.
Both widgets are configurable. Users can set the risk status filter (Open, Closed, All), choose whether to show risks at project or program level, and select what the matrix displays (count of risks, cost impact, time impact, quality, minimum/maximum/expected cost).
Accessing the Widgets
- The Risks Widget is placed on a Project Dashboard, Executive Dashboard, or Strategy Dashboard by an administrator or user with dashboard configuration rights.
- The My Risks Widget is placed on the personal My Dashboard.
What You See
View | What Appears | How to Use It |
|---|---|---|
Collapsed View | The risk matrix and date counters are visible. | Click a matrix cell or date counter (Today, Tomorrow, Week, Month, Overdue) to filter the detail grid when you expand the widget. |
Expanded View | The full risk grid appears beneath the summary. | Click the expand/collapse toggle to show or hide it. |
Interacting With the Matrix
- Each color-coded cell represents a combination of probability and impact. Click a cell to filter the grid to risks at that probability/impact level.
- The legend on the right of the matrix shows risk level labels (for example, Low, Medium, High) and a total count.
Interacting With the Grid
Action | How |
|---|---|
View/Edit a risk | Click the window icon or the description link in a row. |
Navigate to the project | Click the project name in the grid. |
Close a risk | Click the close icon on the row. |
Reopen a risk | Click the reopen icon on a closed risk row. |
Transfer to an issue | Click the Transfer button. This is visible only if issues are enabled and the risk is not already transferred or closed. |
Delete a risk | Click the delete icon. This requires delete rights and configuration. |
View/Add documents | Click the document icon on the row. |
Export to Excel | Use the Export button in the grid toolbar. |
Configuring the Widget (Settings)
Open the widget settings panel using the cog/settings icon on the widget. Options differ slightly between the two variants:
Setting | Risks Widget | My Risks Widget |
|---|---|---|
Widget Title | Customize the display name. | Set the widget title. |
Risk Status | Open, Closed, or All | Open, Closed, or All |
Show | All risks, risks for this project, or program-level risks. This is not available on Executive/Strategy Dashboards, which have a simpler toggle. | Not applicable. |
Matrix | Choose whether matrix cells display Number of Risks, Cost Impact, Time Impact, Quality, Min Cost Impact, Max Cost Impact, or Expected Cost. Options depend on system configuration. | Uses the same matrix display options. |
Tips and Gotchas
Access rights: If you do not have any View, Edit, or Add rights for Risks on a project, the Risks Widget displays an access-denied message and hides the grid and summary.
- Overdue risks (past target date, not closed, and not transferred) are highlighted in red in the Target Date column.
- The Transfer button converts a risk into an issue. This requires Can Add rights on the project.
- Columns that are not enabled in the system configuration, such as Cost Impact, Time Impact, Quality, Free Text fields, or Custom Dropdowns, are hidden automatically.
- For Honeywell-licensed installations, a different set of columns is shown or hidden compared to standard installations.
Was this article helpful?
That’s Great!
Thank you for your feedback
Sorry! We couldn't be helpful
Thank you for your feedback
Feedback sent
We appreciate your effort and will try to fix the article