My Projects Widget
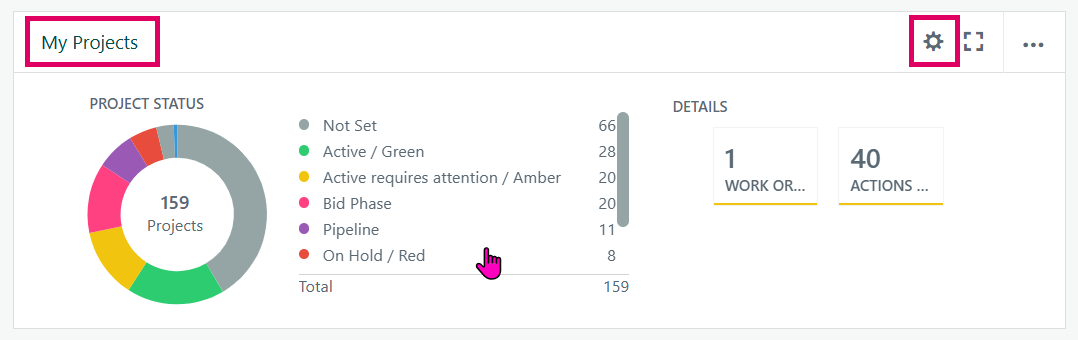
The My Projects widget is a personalised portfolio overview panel that lives on the Cora PPM "My Dashboard." Its purpose is to give the currently logged-in user an at-a-glance summary of every project they are a member of, grouped by a configurable dimension (most commonly Project Status), together with actionable detail counts and optional financial health information.
What the Widget Shows
Left side — Summary Chart
A visual chart (defaulting to a donut/ring chart, but configurable to bar, column, pie, or treemap) shows all of the user's projects broken down by the chosen grouping dimension. Each segment or bar is coloured according to the project status colour defined in system configuration (e.g., green for Active/Green, amber for Requires Attention, grey for Not Set). The centre of the donut displays the total project count. A scrollable legend beneath (or beside) the chart lists every segment with its count. Clicking any segment or legend row filters the project grid that appears in the expanded view.
Right side — Details section (the summary "tiles")
A horizontally-scrolling carousel of small summary tiles shows aggregate open-item counts across all visible projects. Each tile is labelled and counted; for example: "40 Actions" (open risks or issues) and "1 Work Orders" (open custom register records). These tiles are configurable — an administrator can choose to show Risks, Issues, and/or any active Custom Registers. Clicking a tile filters the expanded grid to show only the relevant projects.
Financials bar (optional)
When enabled, a horizontal bar beneath the Details section shows aggregate budget vs actuals/commitments across all projects. An over-budget alert badge appears if any project has exceeded its planned spend.
Expanded grid view
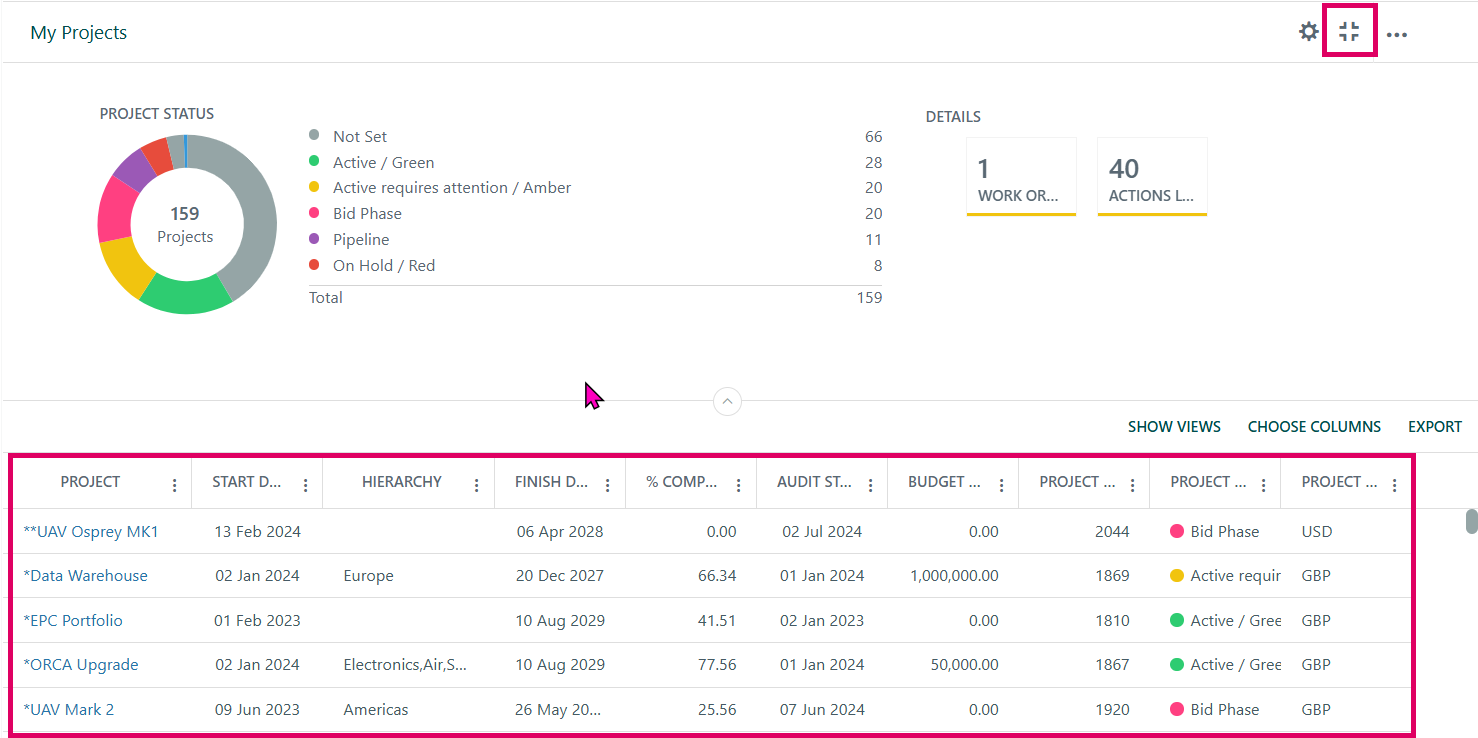
Clicking the expand/fullscreen icon opens a full-width grid listing all matching projects with configurable columns (project name, status, type, dates, risks, issues, CPI, SPI, financial figures, custom fields, late tasks, etc.). The grid supports sorting, filtering, saved views, and Excel export.
Scope — "My Projects"
Unlike the broader "Projects" widget (which is administrator-configured), My Projects is user-scoped. It only shows projects where the logged-in user has an active role, filtered by the project profiles (roles) selected in the widget settings. An additional "Filter By" dimension (e.g., filter down to only projects with a specific custom field value) can further narrow the scope before the summary chart is drawn.
Multi-currency support
If multi-currency is enabled and the user has selected a dashboard currency, all financial figures (budget, actuals, commitments) are converted to that currency using foreign-exchange rate logic. If projects span multiple currencies with no unified rate, the financials bar is suppressed.
Widget title and gear icon (highlighted in the screenshot)
- The title ("My Projects") is fully customisable per-instance in the settings panel.
- The gear icon opens the widget's settings panel (MyProjectsSettings.aspx) in a modal dialog where all of the options described below can be configured.
- The ellipsis (…) menu offers Export (to Excel or image), Delete, and other options.
- The expand icon toggles the full-height grid pane.
My Projects Widget Settings
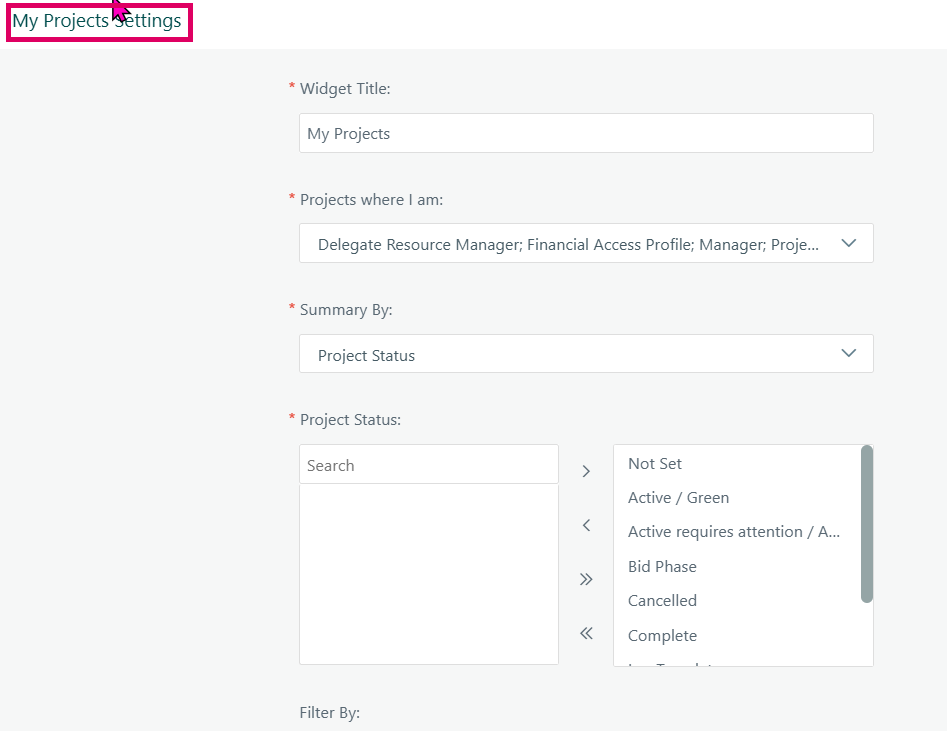
The My Projects Settings panel is the configuration interface for the "My Projects" dashboard widget in Cora PPM. This widget is designed specifically for individual users on their personal dashboard (My Dashboard), and its purpose is to show each user a personalised view of the projects in which they personally hold a role — unlike the broader "Projects" widget, which shows all projects on an executive or project dashboard.
What the widget does at runtime: After configuration, the widget renders two areas — a summary chart (doughnut, pie, bar, treemap, etc.) that groups projects by a chosen dimension (e.g. Project Status), and an expandable grid below it that lists individual project details. The user can click a slice or bar on the chart to filter the grid to just those projects.
What each setting in the panel controls:
- Widget Title — A free-text label (max 100 characters) displayed as the widget's heading on the dashboard. Required. The default is "My Projects" (localised).
- Projects where I am (required, shown as "Projects where I am" using the system-level project noun, e.g. "Projects where I am") — A multi-select tri-state dropdown tree that lets the user pick which project roles (profiles) qualify them. For example, selecting "Manager", "Delegate Resource Manager", "Financial Access Profile" means the widget will only show projects where the logged-in user holds at least one of those roles. Custom user-list fields (Smart Form user fields) can also appear here, with negative IDs distinguishing them from standard profile roles. By default, all roles are selected. If no specific selection is made, all profile IDs are used as a fallback.
Summary By (required) — A dropdown tree selecting the dimension used to group and chart the projects. The built-in options are:
- Project Status (default) — groups by the project's health/status value
- Phase Status — groups by the current phase status (only visible if Project Phases are enabled in system configuration)
- Project Type — groups by project type
- Custom smart-form dropdown fields — any non-archived dropdown or dropdown-function custom fields defined in the system also appear here, enabling grouping by any project attribute
- [Summary By] Status dual-listbox (required when "Project Status" is chosen — shown as "Project Status" in the UI) — A
PvSwaplistcontrol with two panels. The left panel lists available status values; the right panel holds selected values that will appear in the chart. Transfer buttons (single-right, single-left, double-right "move all", double-left "remove all") move items between sides. A search box enables filtering. The items in this list come from the liveproject_statustable and always include a special "Not Set" entry (for projects with no status assigned). All statuses are selected by default. This list dynamically changes its label and content when a different "Summary By" dimension is chosen (e.g. switching to "Project Type" replaces it with a type list). - Filter By — A secondary optional dimension dropdown (same source as "Summary By") that, when selected, reveals another dual-listbox. This allows the user to pre-filter which projects appear in the widget at all — independent of the Summary By grouping. For example: "Summary By = Project Status, Filter By = Project Type" means only projects of the chosen types are included, summarised by status. The default filter-by value is "Project Status" itself (unlike the plain Projects widget, which defaults to "Select").
- [Filter By] Status dual-listbox — Works identically to the Summary By list but acts as a filter rather than a grouping dimension.
- Hide Details Section — A checkbox that, when ticked, collapses the expandable project grid below the chart. This also causes the widget to resize itself (narrower when details are hidden, wider when shown).
- Show Open Item Counts for — A swap list (only visible when "Hide Details Section" is unchecked) letting the user choose which open-item types (Risks, Issues, custom registers) appear as count columns in the project grid.
- Project Financials — A checkbox toggling whether financial columns (budget to date, cost to date, etc.) are included in the dataset and displayed.
- Project Grid Columns — A multi-category swap list with ordering arrows, allowing the user to choose and sequence which columns appear in the project detail grid. Columns are grouped into "Project Details" (standard fields like Manager, Status, Type, Dates, Effort, etc.) and "Custom Fields" (all non-archived dropdown-reportable custom fields).
- Show smart form group name in column headers — A checkbox (hidden unless a smart form column is selected) that, when enabled, prepends the smart form group name to the custom field column header.
- Display Order — Controls how slices/bars in the chart are ordered: by value ascending/descending, by label ascending/descending, or by "Summary order" (manual ordering via the Summary By swap list's up/down arrows).
- Chart Type — Selects the visualisation style: Donut Chart (default), Pie Chart, Bar chart, Treemap, and others. Treemap hides the Display Order control. Donut and Pie charts hide the Show Legend checkbox.
- Show Legend — Toggles the chart legend (hidden for donut/pie chart types which have their own built-in legend).
- Value Abbreviation Setting — Controls whether large financial numbers are abbreviated (e.g. "1.2M") and how many decimal places to show.
Saving: Clicking the dialog's Save button validates required fields, then persists all settings to the database under the widget key "MyProjects" for the current user. The parent dashboard frame is then notified to reload the widget with the new settings applied. Clicking Reset restores the form to the last saved state without saving.
Was this article helpful?
That’s Great!
Thank you for your feedback
Sorry! We couldn't be helpful
Thank you for your feedback
Feedback sent
We appreciate your effort and will try to fix the article