The Project Dashboard in Cora PPM is a personalised, widget-based home screen scoped to a specific project. It gives users a at-a-glance view of key project information by assembling a collection of individual information panels (widgets) into a resizable, drag-and-drop grid layout. Each widget is an independent panel that can show things like project summary tiles, milestones, risks, issues, financial management data, tasks, resources, and more.
The dashboard is fully customisable per user: each person can choose which widgets appear, arrange them in any order, resize them, save named "views" of their layout (including shared views that colleagues can also use), export the entire dashboard or individual widgets to image or Excel, and switch currency if multi-currency is enabled. The widgets available to any given user are filtered automatically based on which system features and licences are active for their organisation (e.g., Risks and Issues, Financial Management, Portfolio Demand), as well as their own security rights.
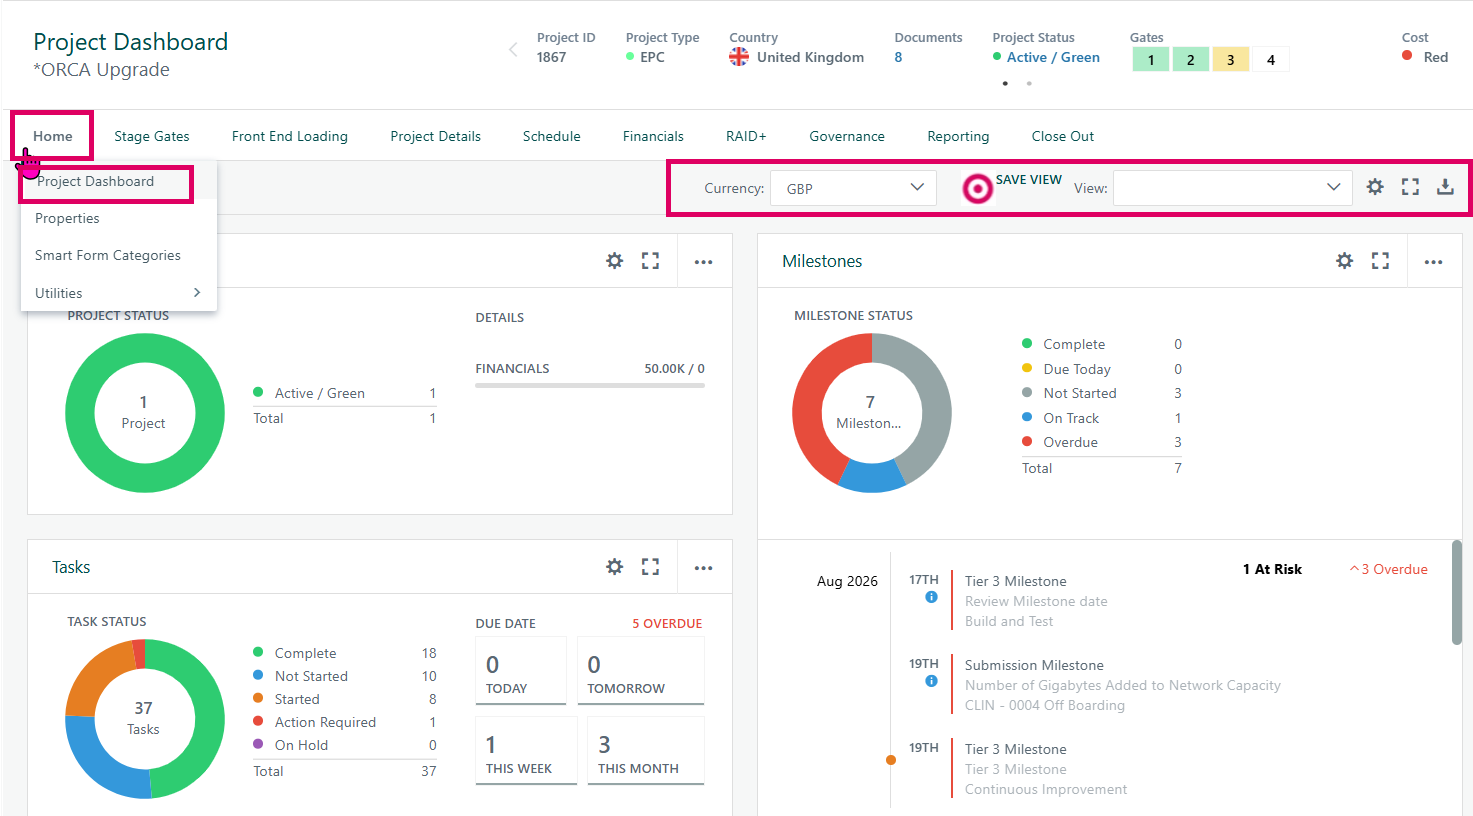
Accessing the Project Dashboard
- Navigate to a project within Cora PPM.
- The Project Dashboard loads automatically at
Project_Dashboard.aspxfor the current project. - You must have the "Can View Project General Report Section" right. If you do not, a "No Access" message is shown and the dashboard is hidden.
Dashboard Header
- Dashboard Title – Shows the page title (e.g. "Project Dashboard").
- Project Name – Shows the current project's description.
- Currency Dropdown – If multi-currency is enabled by your administrator, you can switch the display currency here. Your selection is stored in session and persists during your visit.
- Views Dropdown – Select a previously saved layout view (your own or shared).
- Save View – Save your current widget layout as a named view. You can mark it as shared so colleagues can also access it.
- Manage Views – Opens a dialog to manage, reset, or delete saved views.
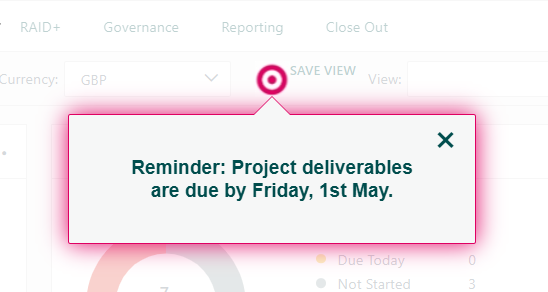
The reminder popup:
- Clicking the bullseye/target icon (circular icon with a red centre) near the toolbar triggers a floating popup overlay.
- The popup reads: "Reminder: Project deliverables are due by Friday, 1st May."
- It has a close button (X) in the top-right corner to dismiss it.
- This is a reminder or notification feature tied to project deliverable deadlines. The message references a specific date, suggesting it is either user-configured or system-generated based on project schedule data.
Dashboard Icons (top-right)
Icon | Action |
|---|---|
Settings (gear) | Opens "Manage Widgets" – choose which widgets are shown |
Expand/Collapse | Expands the dashboard to full screen or returns to normal |
Export | Exports the entire dashboard to an image or Excel file |
Managing Widgets
- Click the gear/settings icon in the dashboard header.
- The Manage Widgets modal opens (
MyDashboardManageWidgets.aspx?DashboardType=1). - Toggle widgets on or off and set how many instances of each to show (up to 10 maximum per dashboard).
- You can also set a default date range for widgets on the Date Ranges tab.
- Click Save to apply. The dashboard reloads with your new widget selection.
- Click Reset to restore default widget settings.
Rearranging Widgets
- Drag widgets by their header bar to reposition them in the grid.
- The layout auto-saves after 1 second of inactivity (no manual save needed for layout position).
- Widgets scroll-load progressively: as you scroll down, additional widgets load on demand.
Per-Widget Actions
Each widget has its own header menu:
- Settings – Configure that specific widget's options (e.g. date range, rollup, display columns).
- Expand/Collapse – Expand the widget to full-screen within the dashboard or collapse it back.
- Export – Export just that widget to image or Excel.
- Delete – Remove the widget from your current layout (it can be re-added via Manage Widgets).
Saving and Switching Views
- Use Save View to capture your current layout (widget selection + positions) as a named view.
- Views can be shared with all users or kept private.
- Use the Views Dropdown to switch between saved views.
- If a shared view you are using has been changed by its owner since you last loaded it, a prompt will appear asking whether you want to reload the updated shared view or keep your current changes.
Exporting the Dashboard
- Click the export icon in the header.
- Choose export type (Image or Excel) in the modal.
- All widgets load before export begins.
- The file downloads automatically. InactiveUsers widgets are excluded from Excel exports.
The Programme Dashboard
The Project Dashboard Roll-Up (Programme Dashboard) is a feature that lets a dashboard widget display aggregated data from the currently viewed project and all of its sub-projects (the whole project hierarchy beneath it), rather than showing data for only the single parent project.
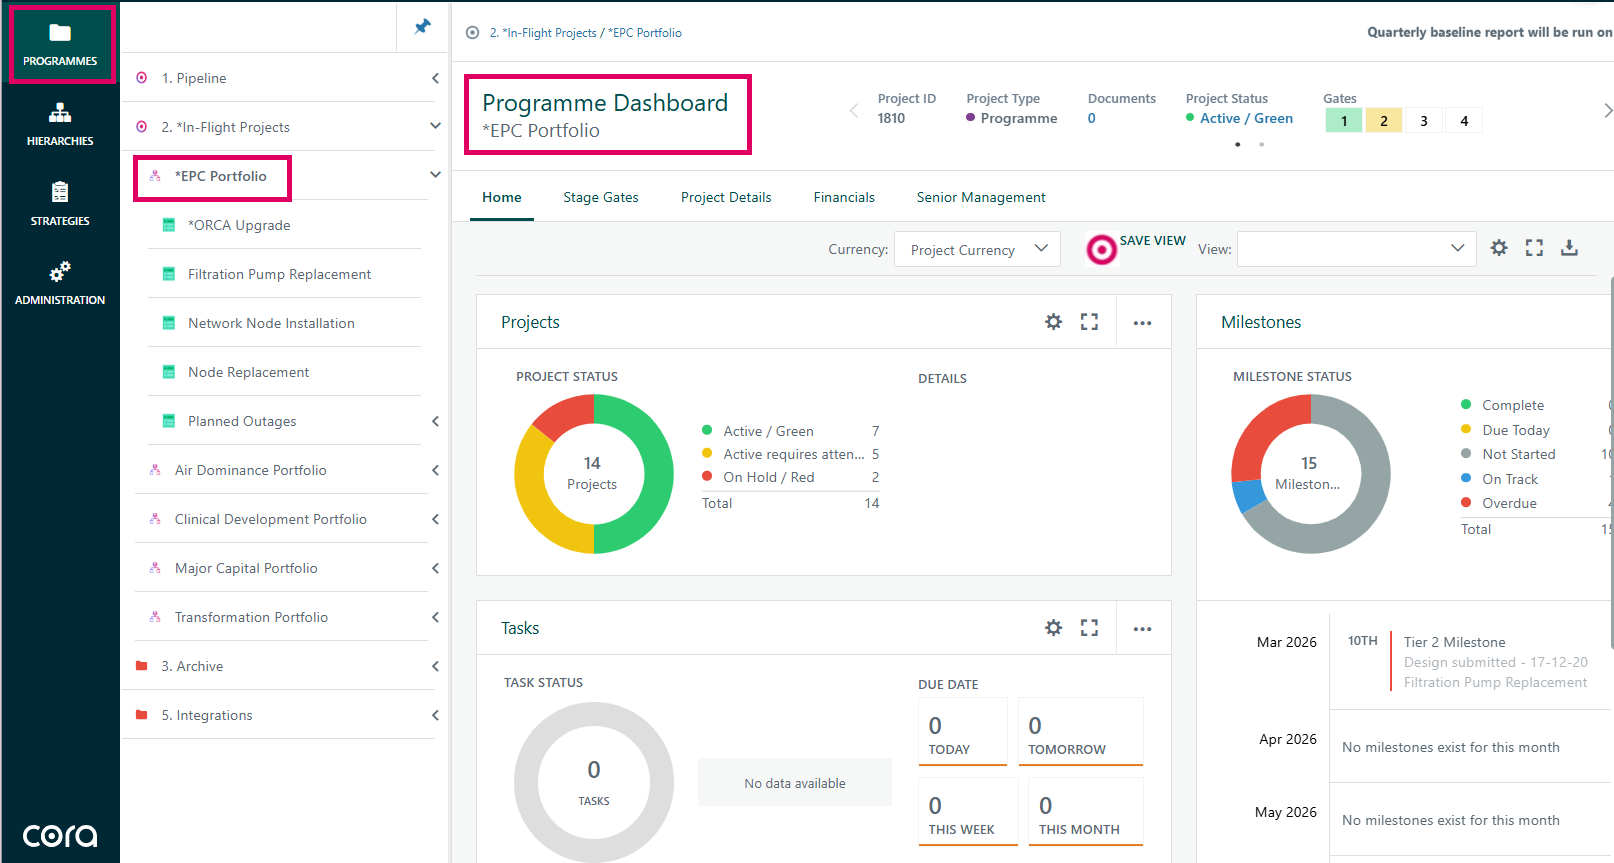
Cora PPM organises projects in a tree hierarchy: a top-level programme may contain many child projects, which may themselves contain sub-projects. When a user views the Project Dashboard for a parent node, each widget on that dashboard can be configured independently — some may show the parent project's data alone, while others may "roll up" data from all the children the logged-in user has access to.
How each widget uses it: Every widget on the dashboard has a LoadWidgetSettings() call that retrieves a persisted per-user setting — the "Rollup" setting. When that setting indicates roll-up is active, the widget pulls the project list from the session cache rather than querying the database again. It then filters the list down to only those sub-projects where the user holds the appropriate access rights, and passes the complete list of project IDs to its data repository or stored procedure. The widget's chart, grid, or tile then reflects the combined totals from all of those projects.
Access control is enforced at two layers: First, the ListAllSubProjectsUserHasAccessTo stored procedure only returns sub-projects where the user has any rights (via the AccessRights_GenerateForUser sub-procedure). Second, each widget independently filters the session list by calling AccessRights.HasAnyRisksIssuesRights() on the rights string, ensuring that a user who has limited access to a sub-project cannot see data from it in a Risks, Issues, or similar widget.
Widgets with roll-up capability include: Summary (tiles for % Complete, Open Risks, Open Issues, Open Opportunities, Open Tasks, Financials), Progress, Risks, Issues, Opportunities, Tasks, Run Rate, Investment Analysis (Benefits), Project Matrix, Waterfall, and Smart Form Fields. Each widget has its own setting page that exposes a radio button or toggle labelled "Show this project only" vs. "Show this project and all sub-projects" (or similar wording). The setting is saved per user, per widget, per project context.
Where to Find the Dashboard
- Navigate to any project in Cora PPM and click the Dashboard tab (or open Project Dashboard from the main navigation).
- The dashboard shows all configured widgets for that project.
Enabling Roll-Up for a Specific Widget
- On any dashboard widget, click the cog / settings icon (usually labelled "Widget Settings" or shown as a gear).
A settings panel opens. Look for a toggle or radio-button group such as:
- "Show this project only" / "Show this project and sub-projects" — (Summary widget, Progress widget, Project Matrix, Waterfall, Smart Form Fields)
- "All" / "Programme level" — (Risks, Issues, Opportunities widgets – this controls whether sub-project items are included)
- "Show all tasks" checkbox — (Tasks widget)
- Select the option that includes sub-projects, then click Save.
- The widget will refresh and display combined/aggregated data from the current project and all accessible child projects.
Roll-Up Scope
- Roll-up includes all projects anywhere in the sub-tree, not just direct children.
- Only projects the logged-in user has access rights to are included. Sub-projects where the user has no rights are silently excluded.
- Archived projects are excluded from the roll-up dataset.
Session Caching Behaviour
- The list of sub-projects is fetched once per session when the dashboard first loads (stored in the browser session). If new sub-projects are created or access rights change after the page loads, a full page refresh (not just a widget reload) is needed to pick up changes. A static
ResetSession()web method is also available that clears the cached list.
Gotchas
- If a widget shows fewer items than expected, check that the user has the correct access rights on the sub-projects. Rights are checked per widget at data-load time.
- The roll-up toggle is per-user and per-widget — enabling it for one widget does not enable it for others on the same dashboard.
- The Summary widget's % Complete tile does not roll up numerical averages across sub-projects; it uses specific pre-aggregated custom-detail variables (fields 205–208) that are computed separately at the database level.
- Roll-up is only available on the Project Dashboard. The Executive Dashboard and Strategy Dashboard use a different mechanism (filtered project lists set at the executive/strategy dashboard level.
Was this article helpful?
That’s Great!
Thank you for your feedback
Sorry! We couldn't be helpful
Thank you for your feedback
Feedback sent
We appreciate your effort and will try to fix the article