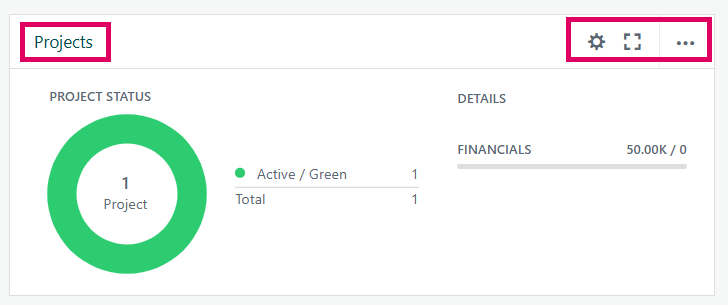
The Projects widget on the Project Dashboard is a composite widget that gives users a visual summary and detailed grid view of sub-projects beneath the current project. It has two distinct sections working together:
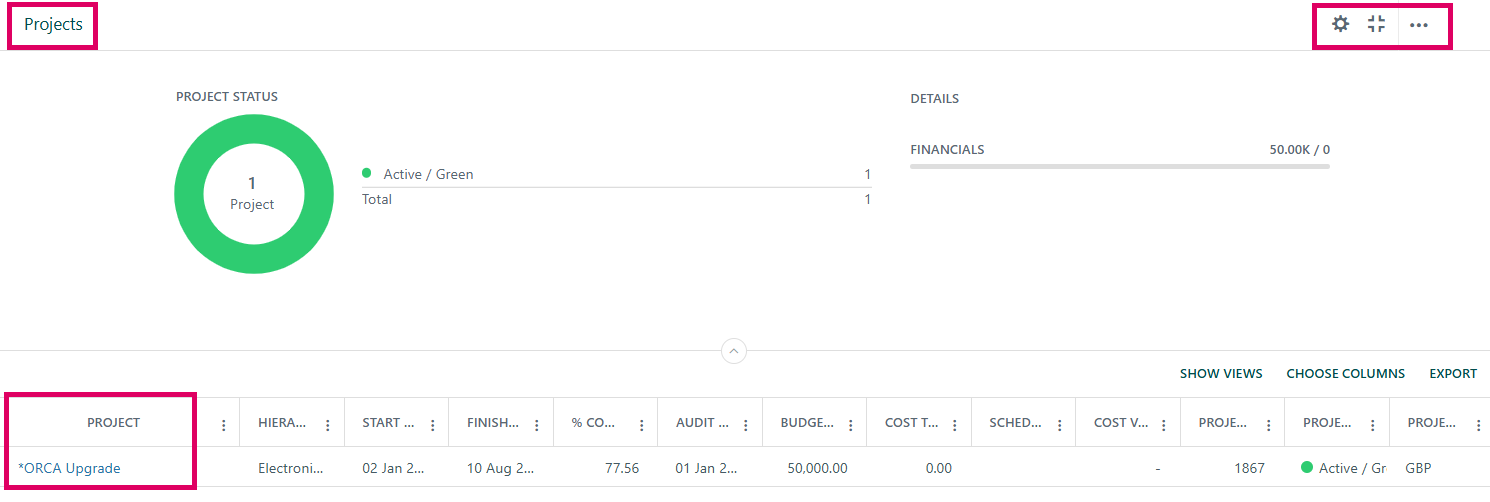
Once expanded a grid will display project information:
- Summary section — A chart (donut, pie, column, treemap, or bar) showing projects grouped and coloured by a chosen dimension (e.g. Project Status, Phase Status, Project Type, or a custom dropdown field). Below the chart there are optional "Details" counters (e.g. open Risks, open Issues, custom register counts) and a Financials bar showing total planned cost vs. actual/commitment spend, with an over-budget alert.
- Details (grid) section — A full data grid listing every sub-project with configurable columns (standard fields like status, dates, durations, financials, CPI/SPI indicators, plus any custom fields). Clicking a chart segment filters the grid to show only the projects in that category. Project names in the grid are clickable links that navigate to that project's own dashboard.
The widget is user-configurable through a settings panel and respects system-level feature flags (Financial Management, Risks & Issues, Multi-Currency, etc.). Users can expand the grid to full-screen, export it to Excel, and sort/filter columns using saved grid states.
Accessing the Widget
- Navigate to Project Dashboard (
Project_Dashboard.aspx?ProjectID=<id>). - The Projects widget ("Projects") appears as one of the configurable tiles in the dashboard grid.
What You See
- Chart area: Displays a coloured chart. Each segment/bar represents a grouping value (e.g. a project status). The centre of a donut chart shows the total project count. A legend can optionally appear beside or below the chart.
- Details bar (carousel): Small counter tiles below the chart showing counts of open Risks, Issues, and/or custom register entries. These scroll if there are multiple items.
- Financials bar: Visible only if enabled. Shows total planned budget vs. actuals+commitments as a progress bar. If any projects are over budget, an alert with a count appears and you can click it to filter the grid.
- Grid: Expands from the widget to show a row per sub-project. Columns include Project Name (as a link), Status, Type, Dates, Financial figures, CPI/SPI indicators, Risks/Issues counts (as links to the Risks & Issues page), Late Tasks, and any configured custom fields.
Configuring the Widget
Click the Settings (cog) icon on the widget header. Options include:
Setting | Purpose |
|---|---|
Widget Title | Custom label for the widget |
Summary By | Dimension to group the chart by (Project Status, Phase Status, Project Type, or a custom dropdown field) |
Status filter (swaplist) | Which values of the chosen Summary By dimension to include |
Filter By | Optional secondary filter dimension (e.g. filter shown projects by a custom field value) |
Hide Details Section | Hides the Risks/Issues/Register counter tiles and Financials bar |
Show Open Item Counts for | Select which details (Risks, Issues, custom registers) to show as counter tiles |
Project Financials | Show or hide the financial bar |
Project Grid Columns | Choose and order which columns appear in the grid |
Show smart form group name in column headers | Adds the smart form group name as a prefix in column headers |
Exclude Sub-Programmes | Whether to exclude sub-programme projects |
Display Order | How chart segments are ordered (by count asc/desc, label asc/desc, or custom "Summary" order using swaplist arrows) |
Chart Type | Donut, Pie, Column, TreeMap, Bar |
Show Legend | Show/hide the chart legend (not available for donut/pie) |
Value Abbreviation | Abbreviate large numbers on the chart (e.g. 10,000 → 10K) |
Click Save to apply. The widget reloads with the new settings. Click Reset to revert unsaved changes.
Interacting with the Widget
- Click a chart segment → The grid below filters to show only projects matching that category.
- Click a project name in the grid → Navigates to that project's own dashboard.
- Click a Risks/Issues count → Navigates to the Risks & Issues page for that project.
- Expand grid to full screen → Use the expand icon on the grid panel.
- Export to Excel → Use the export button in the grid toolbar. A warning toast appears if the export is too large to include status bulb images.
- Column sorting/filtering → Standard grid controls; saved states are preserved per user.
Multi-Currency
- If Multi-Currency is enabled, a currency dropdown appears at the dashboard level.
- Selecting a specific currency converts financial figures in the chart and grid (planned cost, actuals, commitments, custom currency fields) to the selected currency using the project's FX rate service.
- Selecting "Local Currency" shows each project's own currency; the Financials totals bar is hidden if currencies are mixed across projects.
Prerequisites / Access
- The user must have the "Can View Project General Report Section" right on the project. Without it, the entire dashboard (not just the widget) is blocked.
- Financial columns are hidden if Financial Management is disabled system-wide.
- Risks/Issues columns are hidden if those features are disabled.
Tips & Gotchas
- If the grid appears blank after expanding, check that at least one column is configured in settings and that the project has accessible sub-projects.
- The "Display Order: Summary" option only takes effect when you reorder items in the Status swaplist using the up/down arrows.
Was this article helpful?
That’s Great!
Thank you for your feedback
Sorry! We couldn't be helpful
Thank you for your feedback
Feedback sent
We appreciate your effort and will try to fix the article