The Financial Management Widget in Cora PPM provides a unified, time-phased visual and tabular view of a project’s or portfolio’s financial performance across dashboards.
What it Shows
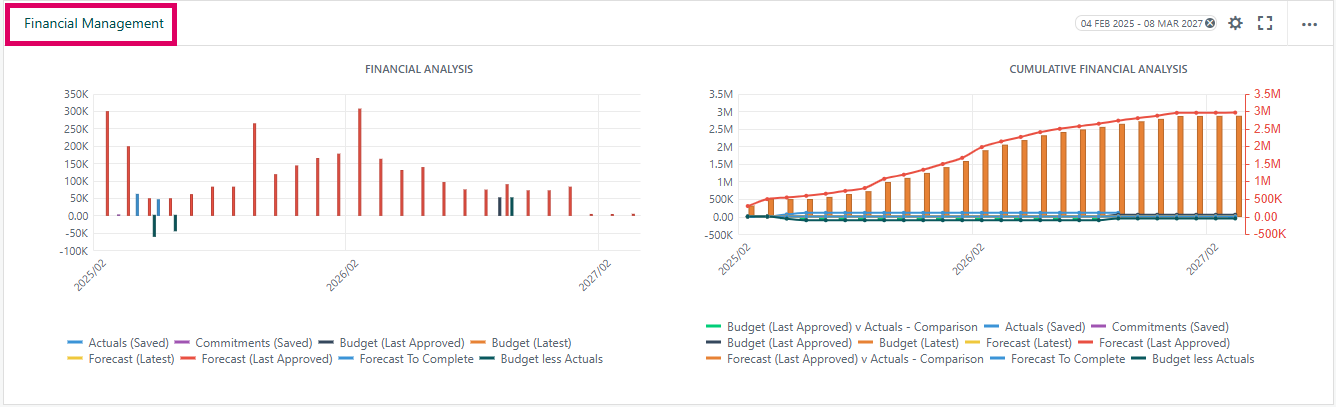
The widget includes interactive charts and a collapsible data grid that respond to the same date range and configuration settings.
Area | Purpose |
|---|---|
Financial Analysis | Shows raw period values as bar chart columns. |
Cumulative Financial Analysis | Shows running totals as line chart values, with optional variance columns. |
Data Grid | Shows the same financial data in a collapsible tabular view. |
Available financial data series include:
- Actuals – money already spent
- Commitments – money contractually obligated but not yet spent
- Actuals & Commitments – combined as a single series
- Budget – approved or saved budget figures
- Forecast – saved, approved, or remaining forecast values
- Variance Comparisons – Budget vs Actual, Forecast vs Actual, and related cumulative comparisons
- Changes Over Time – period-by-period metric changes across iterations
- Revenue and Custom Calculated Values when enabled by administrators
Three Modes of Data
Mode | Description |
|---|---|
The Latest Data | Shows the most current approved or saved iteration of each selected financial type. |
Specific Iterations | Lets users compare up to three named snapshots and optionally display variances. |
How the Data Changed Over Time | Shows the historical evolution of each metric across periods. |
Time Granularity
Financial data can be viewed using the following time levels:
- Period – month by month or system-defined fiscal periods
- Quarter
- Financial Year
The widget is fiscal-calendar aware and respects both standard financial-year start months and non-standard fiscal period configurations.
The Data Grid
View | What it Shows |
|---|---|
By Account Code | Rows grouped by account sub-group and account code, with configurable financial metric columns. |
By Project | One row per project showing totals for every enabled financial column. |
- Rows with all-zero values can be hidden.
- The grid can be exported to Excel.
- Column visibility and ordering can be adjusted by users.
Multi-Currency Support
When multi-currency is enabled, the widget reads the current dashboard currency session value and converts figures accordingly.
In Project Currency mode on the Executive Dashboard, charts are suppressed when multiple project currencies are present. The By Account Code grid is also suppressed because meaningful aggregation across currencies is not possible.
Sub-Project Rollup
The widget can show data for only the current project or roll up values across all sub-projects. For Executive and Strategy Dashboards, it reads the ExecutiveDashboardProjects session collection.
Export
- Image and PDF export are supported through the Telerik client-side export manager.
- Excel export is supported through the grid’s built-in export capability.
Where to Find the Financial Management Widget
- Navigate to a Project Dashboard, Executive Dashboard, or Strategy Dashboard.
- If the widget is already added, it appears as the Financial Management panel.
- If it has not been added, use the dashboard’s Add Widget controls and select Financial Management.
Accessing Widget Settings
- Click the Widget Settings gear or link on the widget header.
- If the widget has just been added, click the Widget Settings link inside the unconfigured message.
- The settings dialog opens with Settings and Graph Options tabs.
Configuring the Widget — Settings Tab
Setting | Purpose |
|---|---|
1. Data Type | Choose Latest Data, Specific Iterations, or Changes Over Time. |
2. What Data Do You Want To See? | Select the financial series that appear on charts. |
3. Plotting Option | Choose Period, Quarter, or Financial Year. |
4. Display | Choose Financial Analysis, Cumulative Financial Analysis, or both charts. |
5. Grid Detail Display | Choose By Project or By Account Code. |
6. Account Code Filtering | Show all account codes, selected codes, CapEx only, or OpEx only. |
7. Show Variance | Add a secondary Variance Y-axis for supported comparisons. |
8. Hide Zero Values | Suppress grid rows where every financial column is zero. |
9. Project Scope | Include only the current project or include all sub-projects. |
10. Date Range | Set custom dates or select a preset range. |
11. Number Abbreviation | Abbreviate large chart-axis numbers and control decimal places. |
12. Do Not Plot Future Actuals | Suppress future actual values when the legacy option is available. |
Items that are not enabled in your system’s Financial Management configuration will not appear in the selection lists.
Configuring the Widget — Graph Options Tab
- A colour picker grid displays each selected series.
- Click the colour swatch next to a series to change its chart colour.
- For each line series, select a Plot Option to control which periods display values.
- Click Save to persist colour and plot option changes.
Reading the Charts
- The Financial Analysis chart shows period-by-period figures as columns.
- The Cumulative Financial Analysis chart shows running totals as smooth line series.
- Variance or comparison series can display as column series on a secondary axis.
- Hover over any bar or point to view the exact value, period label, and series name.
- X-axis labels step automatically when many periods are shown.
- Y-axis numbers use the selected abbreviation setting.
Reading the Grid
- Click the expand icon to open the data grid below the charts.
- By Account Code groups rows by account sub-group and shows subtotals.
- By Project shows one row per project with all financial columns.
- Use the Export to Excel button to download the grid.
Common Gotchas
Use these checks when the widget does not show the expected data.
- If the widget shows “Please configure the widget in Widget Settings”, open settings and select at least one data series.
- If it shows “Charts not shown as there are multiple currencies”, switch to a base currency from the dashboard currency selector.
- If the By Account Code grid is blank with a currency message, switch to a base currency or use the By Project view.
- If an expected option, such as Forecast, does not appear in the swap list, it may be disabled in the system’s Financial Management configuration. Contact your administrator.
Was this article helpful?
That’s Great!
Thank you for your feedback
Sorry! We couldn't be helpful
Thank you for your feedback
Feedback sent
We appreciate your effort and will try to fix the article