The Portfolio or Executive Dashboard (the nameing is configurable) is Cora PPM's central cross-portfolio view designed for senior stakeholders and portfolio managers. It aggregates live information from every project the user has rights to access and presents it in three complementary views within a single page.
What it does
List View (Portfolio Analysis Grid)
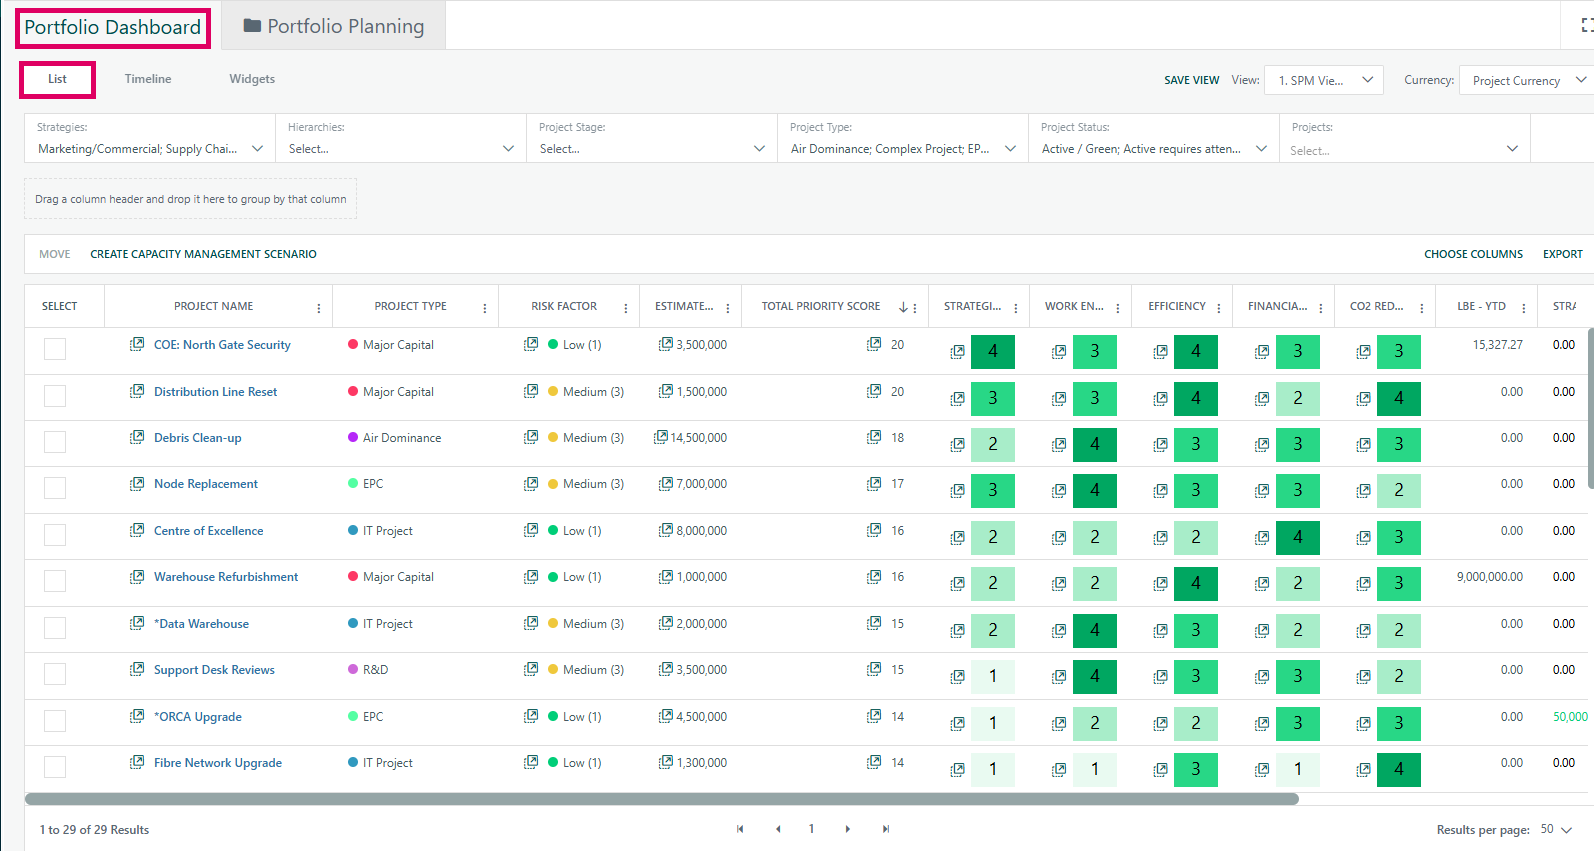
A fully configurable tabular grid that shows every accessible project as a single row. Each column can be standard project data (name, type, start/end dates, % complete, status, stage, priority, organisation, strategy, risks, issues, financials, duration, path, exchange rate etc.) or a Smart Form custom field or a count of items in a custom register — all configured by administrators. Columns can be hyperlinked so that clicking a value navigates directly to the relevant area of that project, or pops up an inline edit modal (Direct Update). The grid supports grouping by dragging any column header to the group panel, column freezing, column-level filtering (with a filter bar), multi-row selection, and export to Excel.
Timeline View
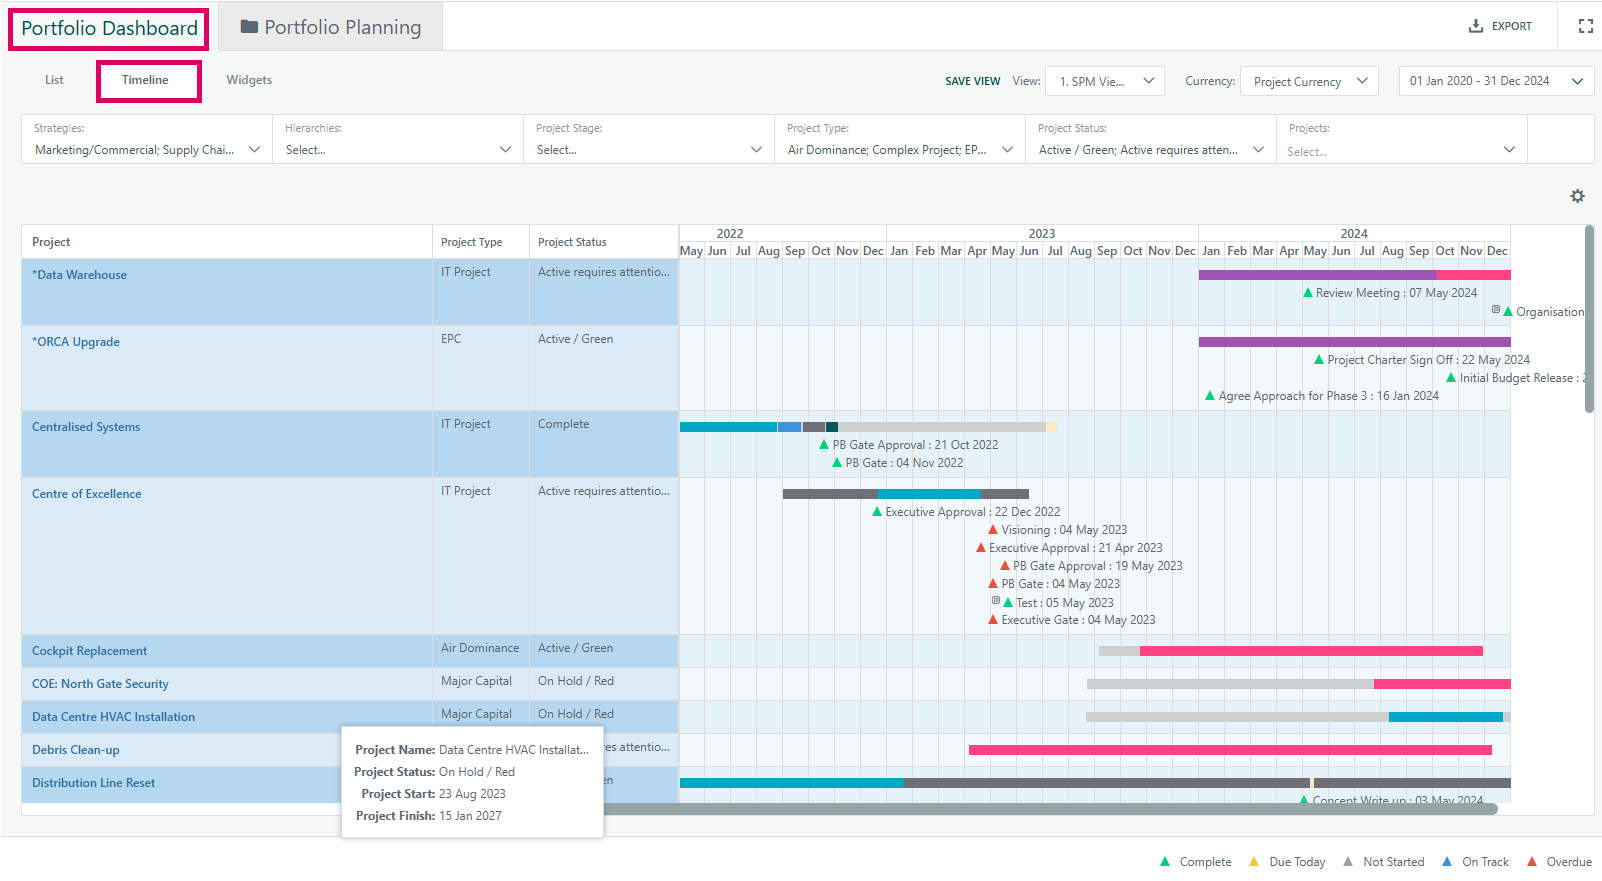
A Milestone Gantt chart that spans all filtered projects on a single time axis. Projects appear as bars with milestones/deliverables plotted as coloured symbols (green = complete, red = overdue, yellow = due today, grey = not started, blue = on track). The timeline can be grouped by Strategy, Organisation, Stage, Type, Status, or Programme Structure hierarchy. Users control the date range, scale, baseline display (first/last approved), tooltips, phase overlay, key activities, colour coding, and which columns appear alongside the Gantt rows. A configurable maximum number of projects prevents performance degradation; a warning banner is shown if the limit is exceeded.
Widgets View
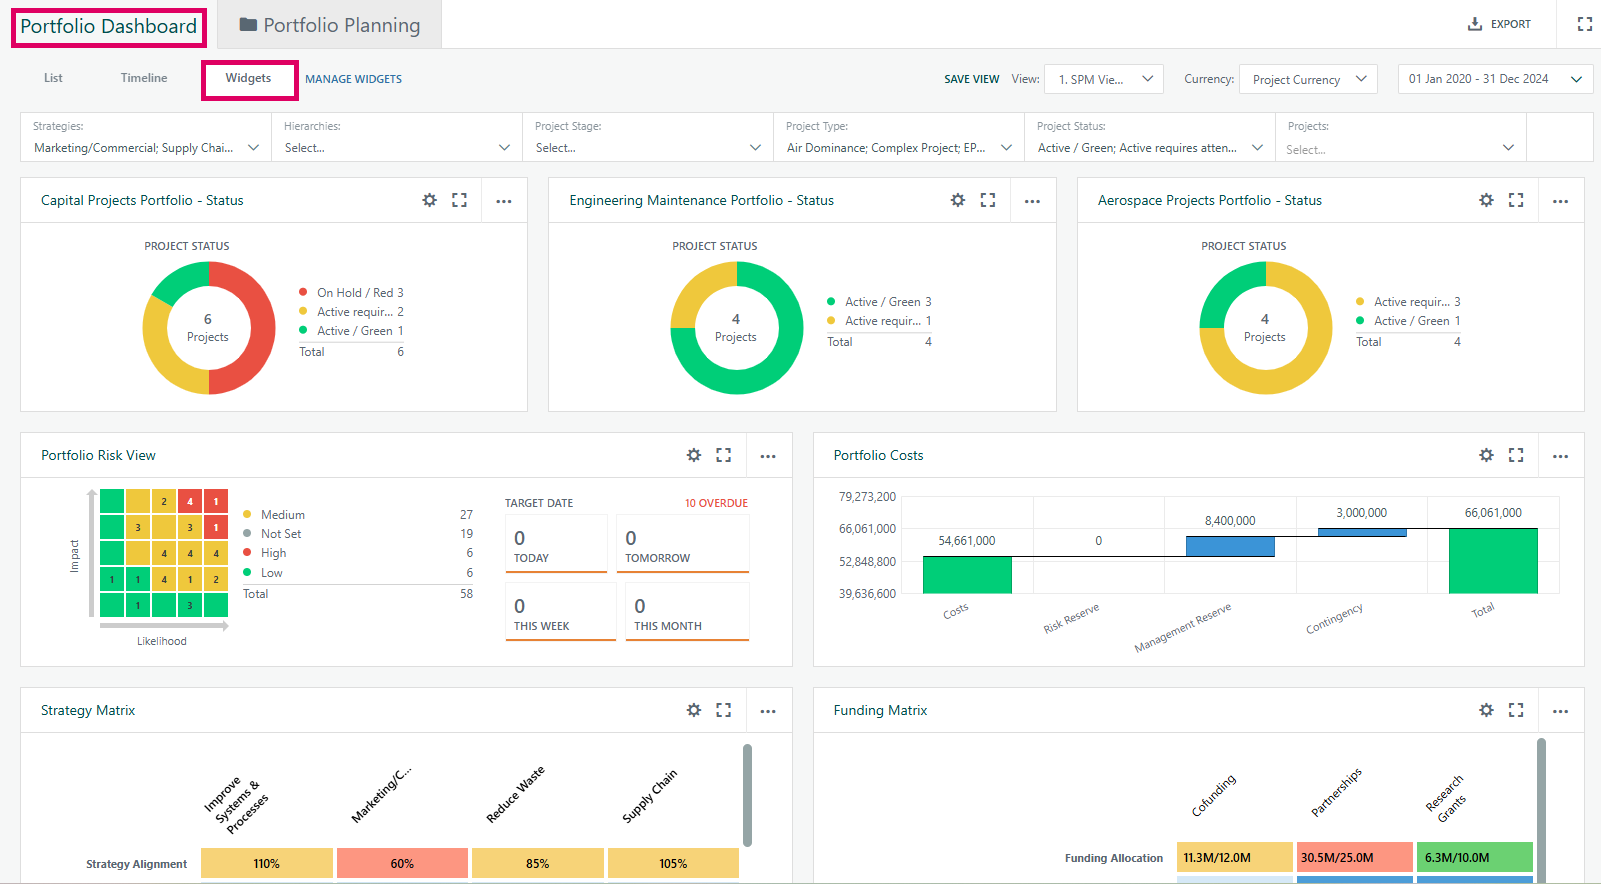
A drag-and-drop canvas of independently loaded chart and summary widgets (rendered as iframes via GridStack). Each widget is independently sized, positioned, and configurable. Available widgets include Financial Management, Risks, Issues, Opportunities, Strategy Matrix, Funding Matrix, Bubble Chart, Projects by Attribute, Waterfall, and others — their availability depends on licensed features and system configuration. Users can add, remove, reorder, and resize widgets. Changes are auto-saved. The entire canvas can be exported as a PNG or Excel file.
Filters and personalisation

A filter bar at the top of the page lets users narrow the project set by: Strategy, Organisation, Project Stage, Project Type, Project Status, specific Projects, and (when the Portfolio Planning toggle is on) Scenarios. Filter selections are persisted per user and restored on next visit. Users can also save named "Views" that snapshot their current grid column layout and filter state, allowing quick switching between different perspectives on the portfolio. Views can be shared across users.
Portfolio Planning and Scenarios
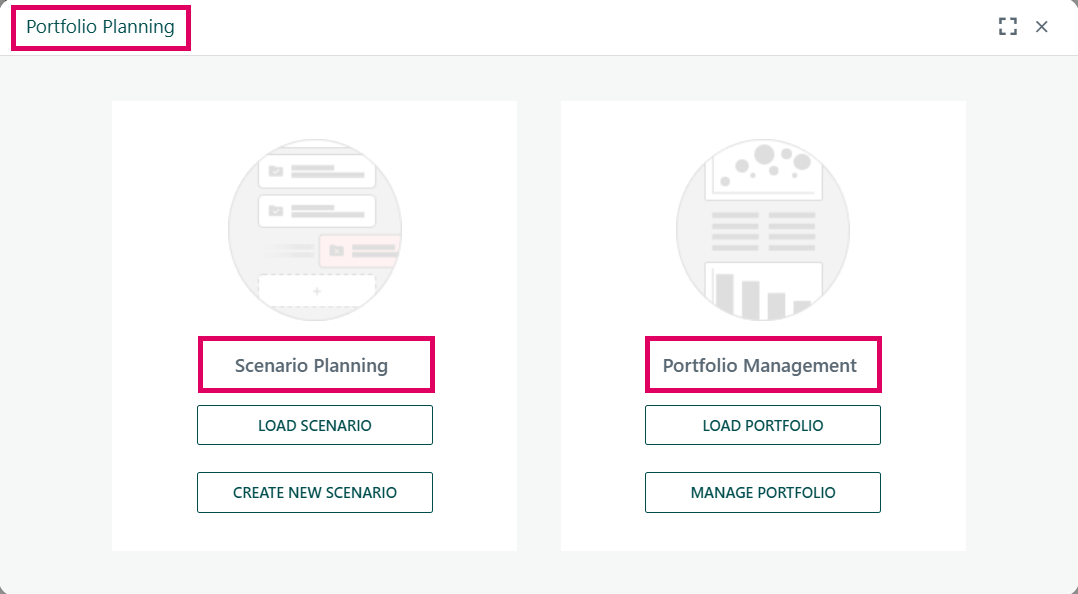
When Portfolio Planning is enabled, a "Portfolio Planning" tab header appears. Users (Portfolio Managers) can load a saved Scenario — a curated subset of projects with a named budget threshold. When a Scenario is active, a secondary grid (the Scenario Grid) appears showing only the scenario's projects in priority order, with drag-to-reorder for priority, a threshold line showing where the budget is breached, a Remaining budget indicator, and summary panels. Projects can be added from or removed back to the main portfolio grid. The scenario can be compared, duplicated, or linked to a Capacity Management (What-If) scenario. A workflow state indicator shows the scenario's approval status.
Multi-currency support
When Multi-Currency is enabled, a currency toggle in the header lets users switch between viewing financial figures in each project's local currency or a single base currency. The selection is remembered per user. Column totals in the footer are suppressed when projects have mixed currencies and no base conversion is applied.
Accessing the Protfolio/Executive Dashboard
- Navigate to Executive Dashboard from the top navigation menu (visible only if an administrator has enabled "Show Executive Dashboard in Menu" in Dashboard Configuration).
- The page opens on the List tab by default (can be changed per-user by remembering the last-used tab).
Switching Between Views
- Use the List / Timeline / Widgets tab strip below the filter bar to switch views.
- The Export button in the top-right header area adapts: on the Widgets tab it exports the canvas; on the Timeline tab it exports the Gantt.
- The Manage Widgets button is only visible on the Widgets tab.
- The date range picker is only visible on the Timeline and Widgets tabs.
Using the Filters
- Filter dropdowns appear in the header: Strategy, Organisation, Project Stage, Project Type, Project Status, Projects (specific project selector), and Scenarios (if enabled).
- Selecting or deselecting options triggers an automatic refresh (approximately 1-second delay after the last change).
- If the number of projects exceeds the configured maximum, a warning banner appears and the grid displays no data — narrow your filters.
- Administrators control which filters are visible, their order, and whether sub-projects are automatically selected with their parents (via Dashboard Configuration → Executive Dashboard).
Working with the List Grid
- Column setup: Administrators configure which columns appear and in what order via Admin → Configuration → Dashboards → Executive Dashboard → List View Columns.
- Group by: Drag any column header to the grey Group Panel to group rows by that attribute. Click the expand/collapse icons to show or hide groups.
- Filter columns: Type in the column header filter boxes to filter within the currently loaded data.
- Select projects: Tick the checkbox on each row to select projects for the Move action (relocate projects to a different programme), or when a Scenario is active, to add them to the Scenario.
- Move: Select one or more projects and click Move in the grid toolbar to open the move dialog.
- Create Capacity Management Scenario: Click this toolbar button (visible to Portfolio Managers only when the skill planning feature is on) to create a What-If Capacity Scenario from the current project set.
- Export to Excel: Use the export option in the grid toolbar.
Working with the Timeline
- Use the Timeline Settings (cog icon on the Gantt) to configure scale (weeks/months/quarters), grouping, baseline display, milestone types, tooltips, colours, and key activity filters.
- Use the Date Range picker in the header to change the period shown.
- The timeline auto-refreshes when dashboard filters change.
- A configurable maximum (default 250, up to 500 with the ExceedDashboardLimits toggle) limits how many projects are drawn.
Working with Widgets
- Click Manage Widgets to open the widget catalogue. Add widgets using the counter next to each widget name.
- Drag widget headers to reposition; drag the resize handle to resize.
- Each widget has a ⋮ context menu: Export (image or Excel), Settings (widget-specific configuration), and Remove.
- Click the expand icon on a widget to make it fill the page.
- Widget layout is auto-saved one second after the last change.
Portfolio Planning (Scenarios)
- Click the Portfolio Planning header tab (visible to Portfolio Managers with the feature enabled).
- Use the Open/Load Scenario option to load an existing scenario, or Create New Scenario to define one.
- When a scenario is active, a scenario summary strip appears at the top showing: scenario name, number of projects, threshold budget, and remaining budget.
- In the Scenario Grid (right-hand tab): drag rows to reprioritise; the threshold-breach row is highlighted and a "Threshold Reached" banner appears at the breach point.
- Use Add to Scenario (checkbox + button in the main Portfolio Analysis grid) to include additional projects.
- Use Remove from Scenario (checkbox + button in the Scenario grid) to drop projects.
- Compare Scenario opens a side-by-side comparison view; Duplicate saves a copy; View Resource Demand creates a Capacity Management What-If Scenario.
- Close the scenario by clicking the ✕ on the scenario tab header.
Saving and Switching Views
- Use the Views dropdown in the header to switch between saved views (your own and shared views).
- Click Save View (accessible from the views dropdown) to snapshot the current grid column layout and filter state.
- Tick Shared when saving to make the view available to all users.
- Switching views on the Timeline or Widgets tabs triggers a full page reload (by design, to avoid ViewState mismatch).
Tips and Gotchas
- If the Maximum Projects limit is reached (shown in the warning banner), no grid data will be displayed. Apply filters to reduce the project count.
- The Timeline has its own separate project limit, which may be lower than the list limit.
- Column totals in the footer are hidden when projects have mixed currencies unless a base currency conversion is selected.
- The Monitor role cannot click hyperlinks in columns — column values are displayed as plain text rather than navigation links.
- A shared view may become "stale" if the owner has updated it since you last loaded it; a prompt will appear offering to reload it.
Was this article helpful?
That’s Great!
Thank you for your feedback
Sorry! We couldn't be helpful
Thank you for your feedback
Feedback sent
We appreciate your effort and will try to fix the article